By the Numbers
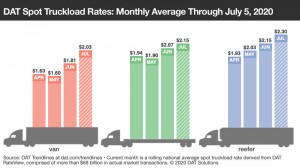
DAT Spot Truckload Market Summary, Week Ending July 5
AJOT | July 10, 2020 | Intermodal | Trucking | By The Numbers
Spot freight activity slowed during the Fourth of July holiday week as the number of loads posted on the DAT network of load boards declined 20% compared to the previous week. The number of truck posts fell 8.5%.
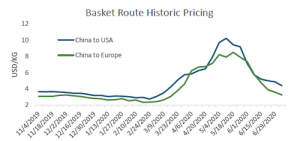
FIS Air Freight Report July 6, 2020
AJOT | July 07, 2020 | Air Cargo | General | By The Numbers
Hong Kong to Europe and Hong Kong to USA routes have been impacted th e most, with the former falling by 61 cents and the later falling by 82 cents.
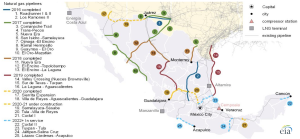
U.S. natural gas exports to Mexico set to rise with completion of the Wahalajara system
AJOT | July 06, 2020 | Energy | Conventional | By The Numbers
EIA expects these exports to increase with the completion of the southern-most segment of the Wahalajara system, the Villa de Reyes-Aguascalientes-Guadalajara (VAG) pipeline.
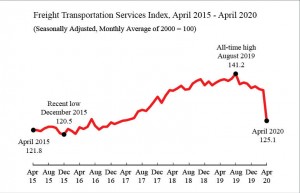
Freight Transportation Services Index (TSI), May 2020
AJOT | July 06, 2020 | International Trade | By The Numbers
The Freight TSI measures the month-to-month changes in for-hire freight shipments by mode of transportation.
When big profits look bad: Drewry
AJOT | July 06, 2020 | Maritime | Liner Shipping | By The Numbers
Container lines have done well during the global pandemic, but are they profiteering from the crisis and can anything be done to prevent more carrier-shipper animosity?

High volume vessel calls as a result of blank sailings put pressure on port operations (WPSP)
AJOT | July 06, 2020 | Ports & Terminals | Ports | By The Numbers
Post-lockdown traffic added to seasonal tourism and essential roadworks causes delays to cargo and traffic at some ports. Vessel crew changes reported for the first time.
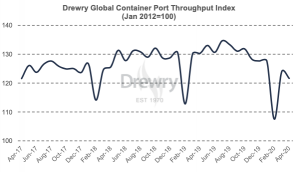
Drewry Port Throughput Indices
AJOT | June 29, 2020 | Ports & Terminals | Ports | By The Numbers
The Drewry Container Port Throughput Indices are a series of volume growth/decline indices based on monthly throughput data for a sample of over 220 ports worldwide, representing over 75% of global volumes. The base point for the indices is January 2012 = 100. Drewry Ports and Terminals insight Drewry’s latest assessment - June 2020 In April 2020, the global container port throughput index stood at 121.6, precisely the same as in April 2017 – three years back. The index declined by 2.3 points compared to March 2020, registering a month-on-month decline of 1.9% and a year-on-year decline of 6.6%. Although the month-on-month deviation remained low at the global level, regional indices had a wide variation in April. The index for North American increased by 7.4% while the index for Asia (excluding China) declined by 7.6%. In February 2020 the China index stood at its lowest level since 2015. It increased to 131.3 in March 2020 and has remained stable with a negligible increase of 0.1 point in April 2020. However this is signifcantly below the April 2019 level, down by 5.7% year-on-year, on basis of weaker demand from key North American and European markets which remainded in lockdown. Volume rebound at West Coast in the USA and Mexico ports in April raised the index for North America by 7.4% over the previous month. However, the continued adverse impact of coronavirus (COVID-19) did not allow North American throughput to reach the April 2019 level. Hence a decline of 8.2% year-on-year was witnessed. The notable feature in 2020 is the declining market share of west coast ports vis-à-vis the gulf and east coast. Despite an improvement in March 2020 index, the Asian countries excluding China could not sustain the recovery into April 2020. The index declined by 10 points to reach 121.2 in April 2020, a decline of 7.6% month-on-month and 5.6% year-on-year. Handling at all major ports including some of the major transhipment hubs in the region declined considerably. Weaker demand from European and North American is tracking back along the intra-Asian supply chains, reducing both deepsea and intra-Asian movements. The only region which saw improvements in its port handling is Latin America, where the index value increased by 2.1% month-on-month and 4.7% year-on-year. On the other hand, the double-digit decline was seen in Africa, although noting that our sample size is small.
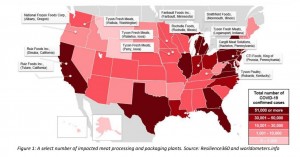
Rising Grocery and Meat Prices
AJOT | June 26, 2020 | Logistics | By The Numbers
A Resilience360 report shows that the meat industry could face massive losses due to COVID-related disruptions
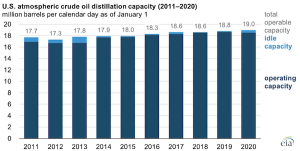
U.S. refinery capacity sets new record as of January 1, 2020
AJOT | June 26, 2020 | Energy | Conventional | By The Numbers
U.S. operable atmospheric crude oil distillation capacity increased 0.9% during 2019, reaching a record of 19.0 million barrels per calendar day (b/cd), up 0.2 million b/cd from the previous record of 18.8 million b/cd the year before.
International wood fiber prices decline
AJOT | June 26, 2020 | International Trade | Commodity | By The Numbers
Wood Fiber Costs Declined for both Softwood and Hardwood Pulp Producers in 2019 and early 2020
Rystad Energy’s daily market comment from our Head of Oil Markets Bjornar Tonhaugen
AJOT | June 26, 2020 | Energy | Conventional | By The Numbers
Traders show some reserved positivity in today’s session. Although oil prices saw some modest gains earlier in the day, the contracts retreated a bit, only to tick up again.
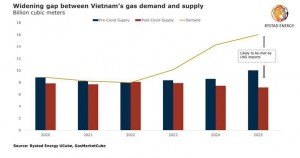
How Covid-19 benefits coal: The case study of Vietnam
AJOT | June 22, 2020 | Energy | Conventional | By The Numbers
The global energy industry downturn at the hands of Covid-19 has not only hurt immediate revenues, but is also affecting national infrastructure and energy policy planning.
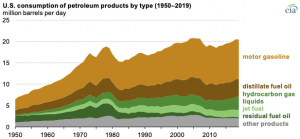
Motor gasoline accounted for almost half of U.S. petroleum consumption in 2019
AJOT | June 22, 2020 | Energy | Conventional | By The Numbers
Petroleum was the largest primary source of energy consumed in the United States in 2019, accounting for 37% of total energy consumed. In 2019, motor gasoline accounted for about 45% of petroleum products consumed in the United States.
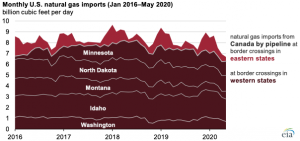
Higher Western Canada spot prices limit U.S. natural gas imports from Canada
AJOT | June 19, 2020 | Energy | Conventional | By The Numbers
U.S. imports of natural gas by pipeline at U.S.-Canada border crossings in the western United States fell to an estimated average of 6.2 billion cubic feet per day (Bcf/d) in April and 6.3 Bcf/d in May 2020, according to Genscape pipeline flow estimates.
FTR Reports May Final Trailer Orders at 4,300 Units
AJOT | June 19, 2020 | Intermodal | Trucking | By The Numbers
New orders are still tepid, and cancellations were elevated for the third consecutive month. Trailer orders for the past twelve months now total 155,000 units.
Weekly Rail Traffic for the Week Ending June 13, 2020
AJOT | June 17, 2020 | Intermodal | Rail | By The Numbers
For this week, total U.S. weekly rail traffic was 449,291 carloads and intermodal units, down 14.9 percent compared with the same week last year.
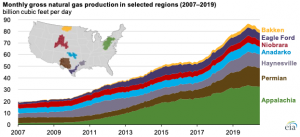
U.S. natural gas production efficiency continued to improve in 2019
AJOT | June 17, 2020 | Energy | Conventional | By The Numbers
The U.S. Energy Information Administration’s (EIA) latest Drilling Productivity Report (DPR) was updated on Monday, June 15.
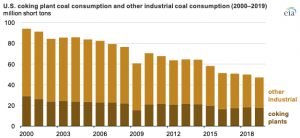
U.S. coal consumption continues to decline across all sectors
AJOT | June 16, 2020 | Energy | Conventional | By The Numbers
U.S. coal consumption has been declining since its peak in 2007 of 1.1 billion short tons. In 2019, U.S. coal consumption totaled 590 million short tons (MMst).
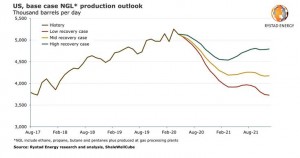
US NGL output set to fall by 20% by end-2021 from March’s all-time high, but Permian will hold up
AJOT | June 16, 2020 | Energy | Conventional | By The Numbers
The US output of natural gas liquids (NGL), which reached an all-time high of 5.3 million barrels per day (bpd) as recently as March 2020, is poised for a steep two-year decline, Rystad Energy’s base case view reveals
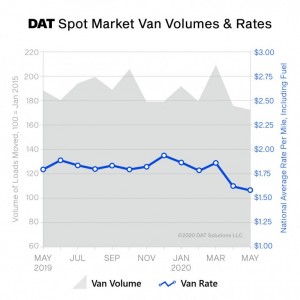
DAT Truckload Volume Index: Spot Market Stabilizes to Pre-COVID Levels, Largely Returning to Seasonal Patterns
AJOT | June 16, 2020 | By The Numbers
After bottoming out at the beginning of May, truckload freight volumes recovered to pre-COVID levels and largely returned to seasonal patterns in the second half of the month, according to DAT Freight & Analytics, which operates the industry’s largest online marketplace for spot truckload freight.
© Copyright 1999–2025 American Journal of Transportation. All Rights Reserved
