By the Numbers

US shale on track to 16% oil growth in 2019
AJOT | May 21, 2019 | Energy | By The Numbers
US shale operators are on course to increase oil production significantly in 2019. The growth in US onshore production from the first quarter through the fourth quarter could come in at around 1.1-1.2 million barrels per day (bpd), or 16% for the full year, according to Rystad Energy.

Venezuelan crude oil production falls to lowest level since January 2003
AJOT | May 20, 2019 | Energy | By The Numbers
In April 2019, Venezuela's crude oil production averaged 830,000 barrels per day (b/d), down from 1.2 million b/d at the beginning of the year, according to EIA’s May 2019 Short-Term Energy Outlook.
FTR Reports April Preliminary Trailer Orders Remain Subdued as OEM’s Fill Order Boards for 2019
AJOT | May 20, 2019 | Intermodal | Trucking | By The Numbers
FTR reports preliminary trailer orders for April 2019 remained subdued for the second consecutive month coming in at 13,200 units, which is 40% below the same month in 2018.
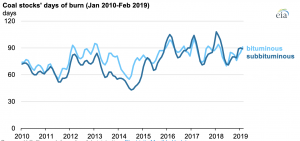
Coal stockpiles at U.S. coal power plants were at their lowest point in over a decade
AJOT | May 17, 2019 | Energy | By The Numbers
U.S. coal stockpiles decreased to 98.7 million tons in February 2019, their lowest value in more than a decade. Total U.S. coal stockpiles have fallen as more coal plants have retired.
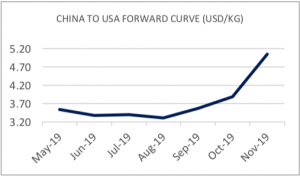
FIS Air Freight Report May 14, 2019
AJOT | May 14, 2019 | By The Numbers
A spike in recorded air freight prices from Asia to US immediately following tariff increases, reflects a quicker-than-expected reaction by the market to escalated trade tensions.
Oil price risks rise to precarious levels
AJOT | May 13, 2019 | Energy | By The Numbers
Supply disruptions in the Middle East on top of an already tight crude market could send oil prices violently upward, according to Rystad Energy.
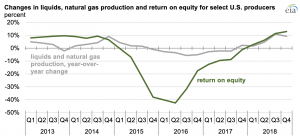
2018 was likely the most profitable year for U.S. oil producers since 2013
AJOT | May 10, 2019 | Energy | By The Numbers
Net income for 43 U.S. oil producers totaled $28 billion in 2018, a five-year high. Based on net income, 2018 was the most profitable year for these U.S. oil producers since 2013, despite crude oil prices that were lower in 2018 than in 2013 on an annual average basis.

New Port Everglades economic impact study released
AJOT | May 10, 2019 | Ports & Terminals | Ports | By The Numbers
Reveals port as a driving force in Broward County's strong economy

April container volumes break record at Port of Los Angeles
AJOT | May 10, 2019 | By The Numbers
Volumes reach 736,466 TEUs, 4.4% increase over previous year

Best Ever April at Port of Long Beach
AJOT | May 10, 2019 | Ports & Terminals | Ports | By The Numbers
Previous cargo high mark for the month was reached in 2006
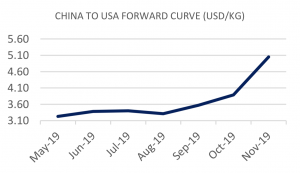
FIS Air Freight Report May 07, 2019
AJOT | May 07, 2019 | Air Cargo | By The Numbers
The Freight Investor Services air cargo market report combines data from The Air Cargo (TAC) Index and perspectives from our wide array of clients to provide an view on the historical, present and future air cargo market.
New Study Reveals The Impact Of Evolving Consumer Buying Behaviors On Global Supply Chains
AJOT | May 07, 2019 | Logistics | By The Numbers
DiCentral Partners with Lehigh University on Research Examining the Transformational Supply Chain Challenges Retailers & Manufacturers Face in the New Online Retail Reality
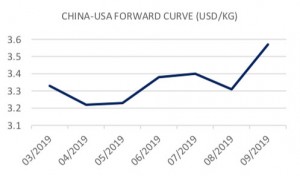
FIS Air Freight Report April 23, 2019
AJOT | April 25, 2019 | Air Cargo | Freighters | By The Numbers
The Freight Investor Services air cargo market report combines data from The Air Cargo (TAC) Index and perspectives from our wide array of clients to provide an view on the historical, present and future air cargo market.

FIS Air Freight Report April 16, 2019
AJOT | April 16, 2019 | Air Cargo | General | By The Numbers
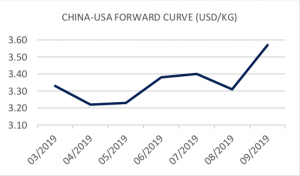
In a sudden reversal of rate growth over the past two weeks, prices have gone into the red. This may represent a natural market correction for carrier oversupply to meet slack demand.
FIS Air Freight Report April 2, 2019
AJOT | April 03, 2019 | By The Numbers
A sea of green with spots of red as the China-US market sees a clear rebound into positive territory after the market reached its base last week. Interestingly the China-Europe lanes show a continued decline in prices indicating a drop in volumes, however market feedback has been the opposite.

FIS | Market Report and Forward Curve 5th March 2019
AJOT | March 05, 2019 | Air Cargo | By The Numbers
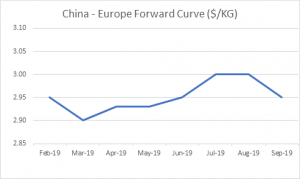
Core Air Routes (AGRs) Trade Lanes The Forward Curve
FIS: Market Report and Forward Curve 26th February 2019
AJOT | February 28, 2019 | Air Cargo | By The Numbers
Rates react to current demand trends, with a significant bounce in rates into Europe conflicting with a drop in rates into North America, at a point where rates have historically been their lowest.

FIS: Market Report and Forward Curve 11th February 2019
AJOT | February 20, 2019 | Air Cargo | By The Numbers
For the most part rates still reflect the uptick in air freight yield found at the end of January.
© Copyright 1999–2024 American Journal of Transportation. All Rights Reserved
