By the Numbers
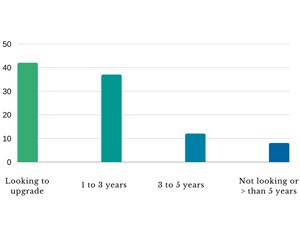
Pandemic business practices accelerate freight digitalization
AJOT | July 22, 2020 | Shipping Technology | By The Numbers
The coronavirus pandemic is proving a catalyst for shipping digitalization, prompting ocean supply chain stakeholders to abandon manual processes and embrace automated transport management solutions to drive business growth, according to a new survey by Haven Inc.
Rystad Energy’s daily market comment from our Head of Oil Markets Bjornar Tonhaugen
AJOT | July 22, 2020 | Energy | Conventional | By The Numbers
Oil prices are declining today but it’s not much of a surprise if one thinks that Brent hit new Covid-19 highs yesterday, in the same day that API reported an unexpected massive weekly stock build. A correction was due and we can see it in today’s market.

ATA Truck Tonnage Index Jumped 8.7% in June
AJOT | July 21, 2020 | Intermodal | Trucking | By The Numbers
American Trucking Associations’ advanced seasonally adjusted (SA) For-Hire Truck Tonnage Index increased 8.7% in June after falling 1% in May. In June, the index equaled 115.3 (2015=100) compared with 106.1 in May.

More than 60% of energy used for electricity generation is lost in conversion
AJOT | July 21, 2020 | Energy | Conventional | By The Numbers
In 2019, U.S. utility-scale generation facilities consumed 38 quadrillion British thermal units (quads) of energy to provide 14 quads of electricity. Most of the difference between these values was lost as an inherent result of the energy conversion process.
Kuehne+Nagel manages the crisis successfully
AJOT | July 21, 2020 | Logistics | By The Numbers
In light of the challenges posed by the coronavirus pandemic and the global lockdown, the Kuehne+Nagel Group achieved a good result in the second quarter of 2020. Market share gains and the cost savings initiated throughout the Group had a positive impact.
Report: 3 out of 4 supply chains adversely affected by COVID-19
AJOT | July 20, 2020 | Logistics | Integrators | By The Numbers
The latest BCI report, COVID19: The Future of Supply Chain, shows the devastating impact the pandemic has had on supply chains, with 73% of organizations encountering ‘some’ or ‘significant’ detrimental effect on the supply side.
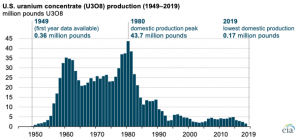
U.S. uranium production fell to an all-time annual low in 2019
AJOT | July 17, 2020 | Energy | Alternative | By The Numbers
The United States produced 174,000 pounds of uranium concentrate (U3O8) in 2019, 89% less than in 2018 and the lowest amount produced since the U.S. Energy Information Administration’s (EIA) data series began in 1949. Domestic U3O8 production has declined since its peak of 43.7 million pounds in 1980.
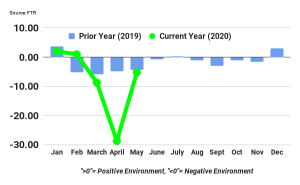
FTR’s May Trucking Conditions Index bounces back sharply from April low but still negative
AJOT | July 17, 2020 | Intermodal | Trucking | By The Numbers
FTR’s Trucking Conditions Index reading for May rebounded from its worst-ever level in April to a reading of -5.19. While much improved, May’s reading is quite negative from a historical perspective. A sharp increase in freight was primarily responsible for the improvement as rates and utilization were still weak.

Uptick in traditional cargos & steady international shipments moving on St. Lawrence Seaway
AJOT | July 16, 2020 | Maritime | Breakbulk News | By The Numbers
American ports in the Great Lakes-St. Lawrence Seaway system handled a diverse mix of inbound and outbound cargos from 20 countries through June, reporting strong activity with wind energy components as well as traditional Seaway cargos. Year-to-date total tonnage—from the opening of the St. Lawrence Seaway on April 1, 2020 through June 30, 2020—increased to 11.7 million metric tons (mt), down 8.4 percent compared to this time last year.

Fraport Passenger Numbers Remain at Very Low Levels
AJOT | July 13, 2020 | Air Cargo | Airports | By The Numbers
Frankfurt Airport and Fraport’s Group airports worldwide see substantial year-on-year decline in passenger traffic – June shows slight improvement from May
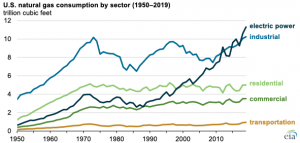
In 2019, the United States produced and consumed record volumes of natural gas
AJOT | July 10, 2020 | Energy | Conventional | By The Numbers
Natural gas is one of the main sources of energy in the United States. In 2019, U.S. production of dry natural gas increased to almost 34 trillion cubic feet (Tcf) and consumption increased to 31 Tcf—both values were records.
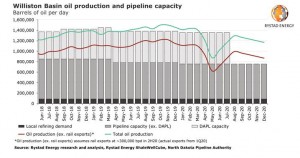
If DAPL pipeline shuts down, hundreds of thousands of US oil barrels will lack an exit route in 2020
AJOT | July 10, 2020 | Energy | Conventional | By The Numbers
A US district court has ruled that the largest outbound Bakken pipeline – the Dakota Access Pipeline or DAPL – shall be emptied within 30 days. If this decree remains in place, hundreds of thousands of produced barrels per day will lack an export route in 2020, Rystad Energy estimates, as alternative options such as other existing pipelines or railway transportation will not be able to fully take on the burden until next year.
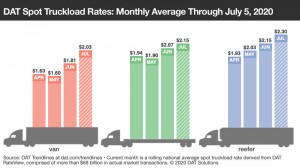
DAT Spot Truckload Market Summary, Week Ending July 5
AJOT | July 10, 2020 | Intermodal | Trucking | By The Numbers
Spot freight activity slowed during the Fourth of July holiday week as the number of loads posted on the DAT network of load boards declined 20% compared to the previous week. The number of truck posts fell 8.5%.
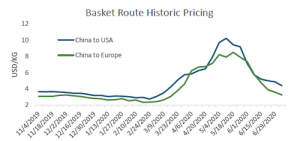
FIS Air Freight Report July 6, 2020
AJOT | July 07, 2020 | Air Cargo | General | By The Numbers
Hong Kong to Europe and Hong Kong to USA routes have been impacted th e most, with the former falling by 61 cents and the later falling by 82 cents.
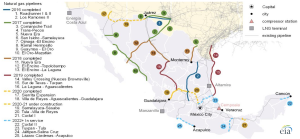
U.S. natural gas exports to Mexico set to rise with completion of the Wahalajara system
AJOT | July 06, 2020 | Energy | Conventional | By The Numbers
EIA expects these exports to increase with the completion of the southern-most segment of the Wahalajara system, the Villa de Reyes-Aguascalientes-Guadalajara (VAG) pipeline.
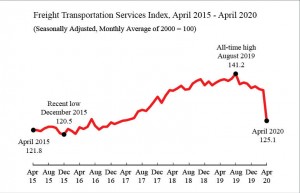
Freight Transportation Services Index (TSI), May 2020
AJOT | July 06, 2020 | International Trade | By The Numbers
The Freight TSI measures the month-to-month changes in for-hire freight shipments by mode of transportation.
When big profits look bad: Drewry
AJOT | July 06, 2020 | Maritime | Liner Shipping | By The Numbers
Container lines have done well during the global pandemic, but are they profiteering from the crisis and can anything be done to prevent more carrier-shipper animosity?

High volume vessel calls as a result of blank sailings put pressure on port operations (WPSP)
AJOT | July 06, 2020 | Ports & Terminals | Ports | By The Numbers
Post-lockdown traffic added to seasonal tourism and essential roadworks causes delays to cargo and traffic at some ports. Vessel crew changes reported for the first time.
Drewry Port Throughput Indices
AJOT | June 29, 2020 | Ports & Terminals | Ports | By The Numbers
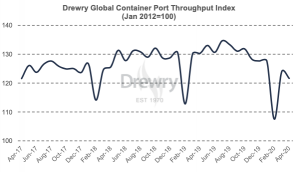
The Drewry Container Port Throughput Indices are a series of volume growth/decline indices based on monthly throughput data for a sample of over 220 ports worldwide, representing over 75% of global volumes. The base point for the indices is January 2012 = 100. Drewry Ports and Terminals insight Drewry’s latest assessment - June 2020 In April 2020, the global container port throughput index stood at 121.6, precisely the same as in April 2017 – three years back. The index declined by 2.3 points compared to March 2020, registering a month-on-month decline of 1.9% and a year-on-year decline of 6.6%. Although the month-on-month deviation remained low at the global level, regional indices had a wide variation in April. The index for North American increased by 7.4% while the index for Asia (excluding China) declined by 7.6%. In February 2020 the China index stood at its lowest level since 2015. It increased to 131.3 in March 2020 and has remained stable with a negligible increase of 0.1 point in April 2020. However this is signifcantly below the April 2019 level, down by 5.7% year-on-year, on basis of weaker demand from key North American and European markets which remainded in lockdown. Volume rebound at West Coast in the USA and Mexico ports in April raised the index for North America by 7.4% over the previous month. However, the continued adverse impact of coronavirus (COVID-19) did not allow North American throughput to reach the April 2019 level. Hence a decline of 8.2% year-on-year was witnessed. The notable feature in 2020 is the declining market share of west coast ports vis-à-vis the gulf and east coast. Despite an improvement in March 2020 index, the Asian countries excluding China could not sustain the recovery into April 2020. The index declined by 10 points to reach 121.2 in April 2020, a decline of 7.6% month-on-month and 5.6% year-on-year. Handling at all major ports including some of the major transhipment hubs in the region declined considerably. Weaker demand from European and North American is tracking back along the intra-Asian supply chains, reducing both deepsea and intra-Asian movements. The only region which saw improvements in its port handling is Latin America, where the index value increased by 2.1% month-on-month and 4.7% year-on-year. On the other hand, the double-digit decline was seen in Africa, although noting that our sample size is small.
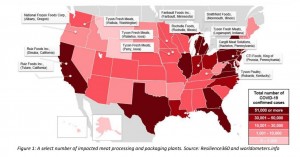
Rising Grocery and Meat Prices
AJOT | June 26, 2020 | Logistics | By The Numbers
A Resilience360 report shows that the meat industry could face massive losses due to COVID-related disruptions
© Copyright 1999–2024 American Journal of Transportation. All Rights Reserved
