By the Numbers

Latin America’s renewable energy capacity set to skyrocket to 123 GW by 2025
AJOT | September 08, 2020 | Energy | Alternative | By The Numbers
Latin America is emerging as a green powerhouse, with some of the strongest renewable capacity growth expected globally in the coming years.
WRI: The Global Forest Industry This Quarter
AJOT | September 08, 2020 | International Trade | Commodity | By The Numbers
Sawlog prices fell in most of the major regions of the world in the 2Q/20. A strengthening US dollar, weaker log demand early in the quarter, and sufficient log supply in some markets contributed to the lower prices.

Europe could see $35 billion in CCS spending till 2035, with most capacity coming in the UK
AJOT | September 08, 2020 | Energy | Conventional | By The Numbers
It’s been a long and costly two decades of carbon capture and storage (CCS) studies and test centers. Now Europe has reached a stage where big-scale developments make financial sense and could trigger up to $35 billion in development spending until 2035 – by which time as much as 75 million tonnes of CO2 could be captured and stored per year on the continent, a Rystad Energy analysis shows.
Rystad Energy’s daily market comment from our Senior Oil Markets Analyst Paola Rodriguez-Masiu
AJOT | September 08, 2020 | Energy | Conventional | By The Numbers
Traders had been happy to support prices throughout the last months, ignoring worrying signals that the oil demand’s recovery would be slowed. Yet the slowdown is now starting to be more evident than ever and these two first weeks of September are weeks of sobering up to the reality.
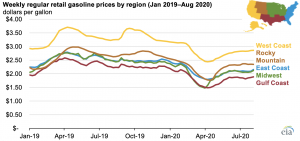
U.S. gasoline prices heading into Labor Day weekend are the lowest since 2004
AJOT | September 04, 2020 | Energy | Conventional | By The Numbers
The U.S. average regular gasoline retail price as of the Monday before Labor Day weekend is $2.22 per gallon (gal) this year, the lowest level for this time of year since 2004, according to the U.S. Energy Information Administration’s (EIA) weekly gasoline price series.
Rystad Energy’s daily market comment from our Senior Oil Markets Analyst Paola Rodriguez-Masiu
AJOT | September 04, 2020 | Energy | Conventional | By The Numbers
The oil market has enjoyed five months of solid gains, but oil prices kick off September on a weak note. During the first week of this month, the Brent benchmark is set to register the biggest weekly decline since early June on concerns about weaker demand and fears of supply increases.

Higher flows amid Mexican refinery woes
AJOT | August 31, 2020 | Energy | Conventional | By The Numbers
President Andres Manuel Lopez Obrador (AMLO) vowed to considerably increase refinery runs earlier this year, and despite a rebound in April, Mexican crude processing has tumbled to 534,000 bpd in July.

More energy is used per person for transportation in states with low population density
AJOT | August 31, 2020 | Energy | Conventional | By The Numbers
States with higher population density, such as Rhode Island and New York, used less transportation energy per capita in 2018.
Container rates slide but carrier performances continue to defy expectations
AJOT | August 31, 2020 | Maritime | Liner Shipping | By The Numbers
Despite the economic shockwaves engendered by the ongoing global pandemic, the world’s leading carriers continue to display signs of effective strategic management skills.
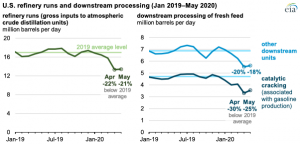
Changing demand for petroleum products has led to operational changes at U.S. refineries
AJOT | August 28, 2020 | Energy | Conventional | By The Numbers
Demand for transportation fuels in the United States has fallen since mid-March because of the spread of coronavirus and efforts to mitigate it.

Port of Baltimore’s July cargo numbers show signs of continued economic recovery
AJOT | August 24, 2020 | Ports & Terminals | Ports | By The Numbers
Increases in cargo volumes and new and returning business from national retailers helped the Helen Delich Bentley Port of Baltimore surge to significantly higher month-over-month numbers in July, signaling a continued rebound from the impact of the COVID-19 emergency.
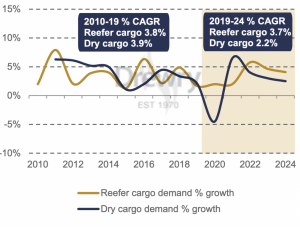
Reefer shipping to outpace dry cargo trade despite container shortages
AJOT | August 24, 2020 | Maritime | Liner Shipping | By The Numbers
Growth in seaborne perishable cargo slowed in 2019 but is forecast to better weather the COVID-19 induced economic storm than the dry cargo trade given the broader resilience of the food supply chain.
Rystad Energy’s daily market comment from our Head of Oil Markets Bjornar Tonhaugen
AJOT | August 24, 2020 | Energy | Conventional | By The Numbers
It’s been a long time since something different to Covid-19 and OPEC is making oil markets move.

Monthly U.S. energy-related CO2 emissions in April were the lowest in decades
AJOT | August 21, 2020 | Energy | Conventional | By The Numbers
Monthly U.S. energy-related carbon dioxide (CO2) emissions fell to 307 million metric tons (MMmt) in April 2020, the lowest value in the U.S. Energy Information Administration’s (EIA) monthly series for CO2 emissions, which dates back to 1973
Rystad Energy’s daily market comment from our Head of Oil Markets Bjornar Tonhaugen
AJOT | August 21, 2020 | Energy | Conventional | By The Numbers
As the dust from this week’s uneventful OPEC+ meeting now has settled, the market realized that the main news takeaway from the event is on non-compliance.

U.S. shipments of solar photovoltaic modules increase as prices continue to fall
AJOT | August 19, 2020 | Energy | Alternative | By The Numbers
In 2019, U.S. shipments of solar photovoltaic (PV) modules, also referred to as solar panels, reached a record-high 16.4 million kilowatts (kW), 2.9 million kW more than the previous record of 13.5 million kW set in 2016.
Rail Traffic for the Week Ending August 15, 2020
AJOT | August 19, 2020 | Intermodal | Rail | By The Numbers
For this week, total U.S. weekly rail traffic was 500,563 carloads and intermodal units, down 6.9 percent compared with the same week last year.
Rystad Energy’s opener comment from our Senior Oil Markets Analyst Paola Rodriguez Masiu
AJOT | August 19, 2020 | Energy | Conventional | By The Numbers
It’s that interesting day of the month again! The OPEC+ alliance is meeting today for its monthly get-together, with traders keeping their eyes open for unexpected surprises and also for compliance hints from the group’s naughty laggards.
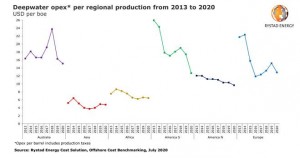
Once the costliest for deepwater opex, South America emerges as cost-saving champion in 2020
AJOT | August 19, 2020 | Energy | Conventional | By The Numbers
South America has made a cost-cutting leap since 2013, when it was the world’s most expensive region for deepwater oil and gas production costs.
ATA Truck Tonnage Index Fell 5.1% in July
AJOT | August 18, 2020 | Intermodal | Trucking | By The Numbers
American Trucking Associations’ advanced seasonally adjusted (SA) For-Hire Truck Tonnage Index decreased 5.1% in July after surging 8.9% in June. In July, the index equaled 109.6 (2015=100) compared with 115.5 in June.

© Copyright 1999–2024 American Journal of Transportation. All Rights Reserved