By the Numbers

Bright spots for Port Houston cargo
AJOT | August 18, 2020 | Ports & Terminals | Ports | By The Numbers
Record gate moves and extra loaders are positive signs this summer at Port Houston. Nevertheless, container twenty-foot equivalent units (TEUs) at the largest container port on the United States Gulf Coast continued showing coronavirus effects and was down 10% in July.
Rystad Energy’s daily market comment from our Head of Oil Markets Bjornar Tonhaugen
AJOT | August 18, 2020 | Energy | Conventional | By The Numbers
Oil prices recorded gains in yesterday’s late session, which they are largely keeping intact this morning, as traders await for news from August’s most interesting event, tomorrow’s OPEC+ meeting.
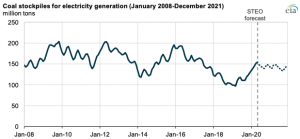
U.S. coal stockpiles steadily increase after reaching lowest level in a decade in 2019
AJOT | August 17, 2020 | Energy | Conventional | By The Numbers
After reaching their lowest level in more than a decade in March 2019, U.S. coal stockpiles steadily increased to 152 million tons in April 2020, recovering to levels not seen in three years.
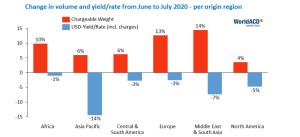
Price per kg dropping by 9% worldwide - volumes on the rise
AJOT | August 17, 2020 | Air Cargo | Freighters | By The Numbers
Since air cargo developments started to completely go “off the charts” in March 2020, every month the question arises whether the next month will be a bit more normal, whatever ‘normal’ may mean.

Port of Long Beach posts biggest month ever
AJOT | August 17, 2020 | By The Numbers
July marked the busiest month in the 109-year history of the Port of Long Beach as terminal operators and dockworkers moved 753,081 cargo container units, topping a record set two years ago.

Port of Los Angeles July volumes are strongest of 2020
AJOT | August 14, 2020 | Ports & Terminals | Ports | By The Numbers
856,389 twenty-foot equivalent units is second-best July in port history
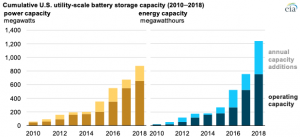
Utility-scale battery storage capacity continued its upward trend in 2018
AJOT | August 10, 2020 | Energy | Alternative | By The Numbers
By the end of 2018, the United States had 125 operational battery storage systems, providing a total of 869 MW of installed power capacity and 1,236 MWh of energy capacity.
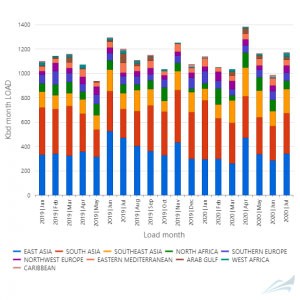
LPG Markets are Back in Favor
AJOT | August 10, 2020 | Energy | Conventional | By The Numbers
July finished with additional signs that the LPG markets are coming back into favor, with overall offtake increasing 14% from June. Higher discharges took place in parts of Asia, where Japanese and South Korean imports each grew 24%, to 324,000 bpd and 333,000 bpd respectively.
Libya’s oil blockade is expected to persist further, shrinking upcoming global production glut by 65%
AJOT | August 07, 2020 | Energy | Conventional | By The Numbers
Libya’s oil blockade is now entering its seventh month and the war-torn country’s oil output is hovering at just 100,000 barrels per day (bpd) instead of the pre-crisis 1.2 million bpd.
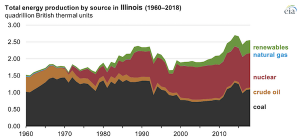
Illinois is a top energy consumer and producer in the Midwest
AJOT | August 03, 2020 | Energy | Conventional | By The Numbers
According to the U.S. Energy Information Administration’s (EIA) State Energy Data System (SEDS), Illinois had the highest energy consumption in the Midwest and was the third-highest energy producer of any state in the region.
Rystad Energy’s daily market comment from our Head of Oil Markets Bjornar Tonhaugen
AJOT | August 03, 2020 | Energy | Conventional | By The Numbers
It’s the first business day of August, the month traders were bracing for, as part of the oil production that OPEC+ has curtailed is returning back on line. Naturally, as oil demand seems to be stalling and the recovery muted for a while, traders are worrying about the effect of the extra supply on balances. A dip in oil prices is therefore justified on the above concerns and today prices are seeing some mild losses as expected. This is an initial reaction of course and the rest of the month should roll on demand signals and taking into account how the Covid-19 pandemic develops. A mini-glut, created by the returning oil production is to be expected for the next 4 months, but demand should pick up from November, so the bearish indicator is likely to only last for the rest of the summer and autumn’s summer blues. The wild card, however, is Covid19 and how it progresses. Our modelling shows that a mild second wave will have an effect this summer and autumn and will fade away till February. But there is a downside in this and if the virus is not contained the effect could spiral further. News from Europe are not as the market hoped for, infections are rising in countries that had so far managed to contain the virus, as lockdowns have been scrapped, and this is a concern, for markets too. The losses this morning are limited, as oil prices are supported by positive surprises in the leading Chinese manufacturing index and Japanese GDP for 2Q, which have boosted spirits in the equities markets in Asia. Today’s data releases will provide further clues for the short term economic recovery globally for August, with the global PMI starting with China’s positive print of 52.8 this morning. However, these positive surprises may not be enough to convince oil traders that all is well ahead for the supply-demand rebalancing. OPEC+ cut tapering has begun, Saudi Arabia will publish its official selling prices for September (expected to reflect a weakening crude market) and global oil supply is set to increase by nearly 2 million bpd m/m in August. Meanwhile, the flat oil demand is also visible via real-time road and aviation indicators. Overall, we believe oil markets will see more volatility during August, compared to the anemic development during July, and prices will be affected on how quickly this extra supply returns. Traders will be keeping an eye on real-time flows, and so will Rystad Energy.
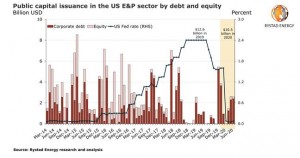
US shale Chapter 11 and M&A review: Investment opportunities in low-cost assets
AJOT | August 03, 2020 | Energy | Conventional | By The Numbers
Several large and small independent US oil and gas producers have filed for bankruptcy this year as their debt burden peaked and hopes of cash flow recovery plunged due to the downturn caused by the Covid-19 pandemic.
South Korea’s export slump eases as external demand improves
Bloomberg | July 31, 2020 | International Trade | By The Numbers
South Korea’s export slump slowed in July, aided by the economic recovery in China and resilient demand for semiconductors.
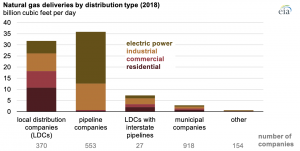
U.S. homes and businesses receive natural gas mostly from local distribution companies
AJOT | July 31, 2020 | Energy | Conventional | By The Numbers
According to the U.S. Energy Information Administration’s (EIA) Natural Gas Annual Respondent Query System, 2,022 natural gas delivery companies delivered natural gas to end-use customers in the United States in 2018.
IAG Cargo releases Q2 results
AJOT | July 31, 2020 | Air Cargo | Airlines | By The Numbers
IAG Cargo today announced its Q2 2020 results, reporting commercial revenues of €369m over the period from April 1 to June 30, 2020, an increase of 33.1 per cent on the same period in 2019 at constant currency.
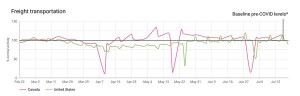
US freight levels see rapid v shaped recovery after COVID shutdown
AJOT | July 27, 2020 | Intermodal | Shipping Technology | Trucking | By The Numbers
The US economy has been striving for recovery since the onset of the COVID-19 pandemic which struck hardest during the month of March.
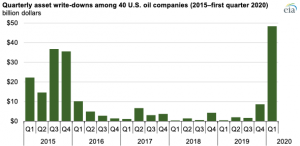
Early 2020 drop in crude oil prices led to write-downs of U.S. oil producers assets
AJOT | July 27, 2020 | Energy | Conventional | By The Numbers
According to publicly filed financial statements, 40 U.S. oil producers collectively wrote down $48 billion worth of assets in the first quarter of 2020, the largest quarterly adjustment since at least 2015.
Rystad Energy’s daily market comment from our Head of Oil Markets Bjornar Tonhaugen
AJOT | July 24, 2020 | Energy | Conventional | By The Numbers
Oil prices lost some of their currency gains in yesterday’s late trading session and the trend continues this morning, with both Brent and WTI facing a modest decline.
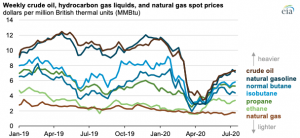
Hydrocarbon gas liquids spot prices are generally bound by crude oil and natural gas
AJOT | July 22, 2020 | Energy | Alternative | By The Numbers
Source: U.S. Energy Information Administration, based on Bloomberg, L.P. The combination of rapidly declining crude oil prices in March 2020 and relatively flat (and historically low) natural gas prices compressed hydrocarbon gas liquids (HGL) spot prices into a narrow price band from mid-March through the end of April 2020. This relatively narrow band has since widened as crude oil prices have increased and natural gas prices have remained low. Generally, HGL prices are based on their heat content and are bracketed by the prices of natural gas (the lower bound) and crude oil (the upper bound). The heat content of a fuel reflects the amount of heat energy released by the combustion of a physical measure of energy, such as a barrel or cubic foot. The U.S. Energy Information Administration’s (EIA) Monthly Energy Review provides information on the heat content of various fuels, including all HGLs. For example, ethane, the lightest HGL, has an approximate heat content of 2.8 million British thermal units (Btu) per barrel. Ethane generally costs about as much as natural gas on a heat-content equivalent basis. Ethane has two carbon atoms, which is one more carbon atom than methane—the primary constituent of natural gas. The supply of ethane has grown more rapidly than the petrochemical industry's ability to consume it as a feedstock. The remaining supply is left in the natural gas stream (a process referred to as ethane rejection), which tends to slightly increase the heat content of a cubic foot of natural gas. Propane, the second-lightest HGL, which has three carbon atoms, has trended closer to other petroleum products because it can easily be substituted for other fuels for such uses as space heating, transportation, or petrochemical feedstock. A surplus of U.S. propane and high transportation costs to reach export markets have discounted U.S. propane compared with other petroleum products and international propane markets. Heavier HGLs typically are priced closer to crude oil. Normal butane and isobutane are widely used in motor gasoline blending in the winter and to produce high-octane gasoline blending components. Natural gasoline, the heaviest HGL, has at least five carbon atoms and can be blended into motor gasoline throughout the year or blended with ethanol as a denaturant (which makes the ethanol unfit for human consumption). Because natural gasoline is a liquid at ambient temperature and pressure, it can more easily be shipped overseas. Natural gasoline is often priced close to crude oil on a heat content basis. Principal contributors: Joshua Eiermann, Warren Wilczewski
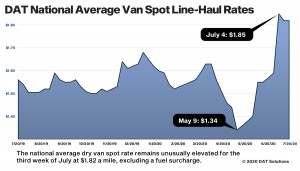
DAT Spot Truckload Market Summary, Week Ending July 19
AJOT | July 22, 2020 | Intermodal | Trucking | By The Numbers
Rates have moved higher week over week since the start of July, an unusual pattern as volumes tend to diminish and dry van capacity typically loosens from now through to early October.

© Copyright 1999–2024 American Journal of Transportation. All Rights Reserved