Reducing CO2 emissions and achieving a sustainable maritime industry
Originaly posted by Maria Bertzeletou, The Signal Group
IMO concluded its 76th Marine Environment Protection Committee (MEPC) during 10-17 June with discussions focusing on actions to tackle climate change, including the adoption of short term measures to reduce carbon intensity of ships and on the more general way forward. This report summarizes the latest trends seen this year in the transition to a greener future for shipping. It also covers the concluding remarks of MEPC 76 and some statistical data on the to-date CO2 performance of the maritime industry.

CO2 Emissions from 2012 to 2018
According to the fourth IMO greenhouse gas study, total CO2 emissions grew by almost 10 percent from 2012 to 2018, accounting for 2.89 percent of total global anthropogenic emissions. The analysis confirms that while total emissions have grown, the carbon intensity of shipping improved between 2008 and 2018, both for international shipping and for the majority of ship types. On average, carbon intensity for international shipping was between 21 and 29 percent lower in 2018 than in 2008, the figures show.
According to research by the International Council on Clean Transportation, published November 2020, the proposed short-term measures to reduce carbon intensity fall into two categories: operational and technical. Ships will be required to address both areas starting in 2023 to help meet IMO’s minimum 2030 carbon intensity goal. Main engine power limitation (EPL), a semi-permanent, overridable limit on a ship’s maximum power, is believed to be the easiest way for older ships to meet Energy Efficiency Existing Ship Index (EEXI) requirements.
Decarbonization solutions: The role of data in call for action
Solutions to reach decarbonization exist and will continue being developed. Data plays a significant role in increasing transparency and pushing for prompt actions. It won’t just be IMO deadlines set on a future date anymore. Satellites, remote sensing technologies, and artificial intelligence will monitor worldwide greenhouse gas emissions in real-time and pinpoint them to specific sources: individual ports, ships, services, and businesses. Such authentic and unprecedentedly detailed emissions data will tighten regulations and shed new light on ESG integration and investing.
Data monitoring is essential for all players, owners and charterers alike, to assess emissions historically and identify load / discharge areas with the highest and lowest CO2 emissions levels per vessel segment. With this method, shipping players can optimize fleet deployment and immediately address short term factors, such as slow steaming and triangulation. By optimally selecting ships for cargoes the industry can, starting today, achieve a direct reduction in the CO2 emissions of shipping. Digital transformation in commercial shipping is now crucial to facilitate decisions that balance profitability with environmental footprint.

CO2 emissions monitoring with the Signal Ocean platform
In December 2020,a new tool in the Signal Ocean Platform was launched covering the tanker and dry bulk segments. Industry participants are now able to consider the CO2 impact when chartering ships alongside their Time Charter Equivalent (TCE) rates. Key influencing factors include not only the emissions during the laden sea passage of a voyage, but also ballasting, route deviations and other operations, all in conjunction with technical ship characteristics, age, shipyard/design, use of scrubbers and type of fuel used.
The Signal Ocean Platform estimates CO2 emissions from AIS data converted into voyages, where all stops for bunkering operations, idle times, repairs, loads and discharge operations have been taken into account. At sea, ballast and laden legs and SECA navigation times are clearly defined. Models that estimate consumptions for each distinct operation have included vessel particulars including country built, year built, scrubber fitting, operational conditions and vessel speeds. Fuel consumption is mapped to different types (VLSFO, MGO, HSFO) based on the area that vessels have been trading as well as the information about if a vessel is scrubber fitted or not and emissions are derived from consumptions using IMO references.
Statistics data on wet CO2 emissions reduction
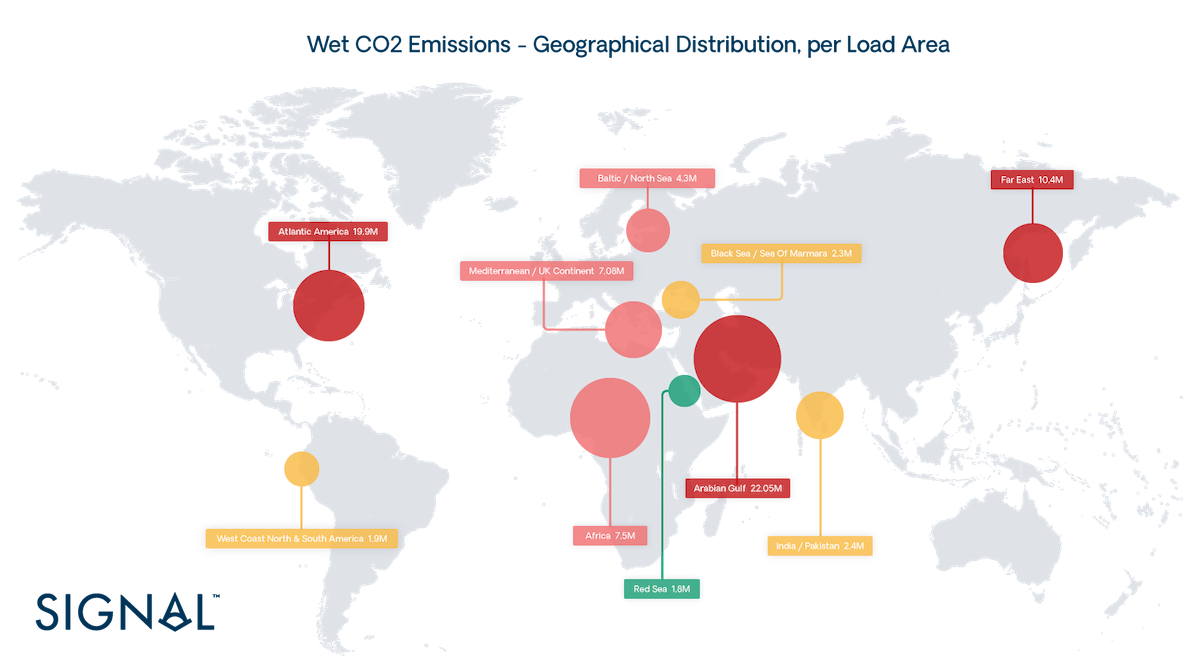
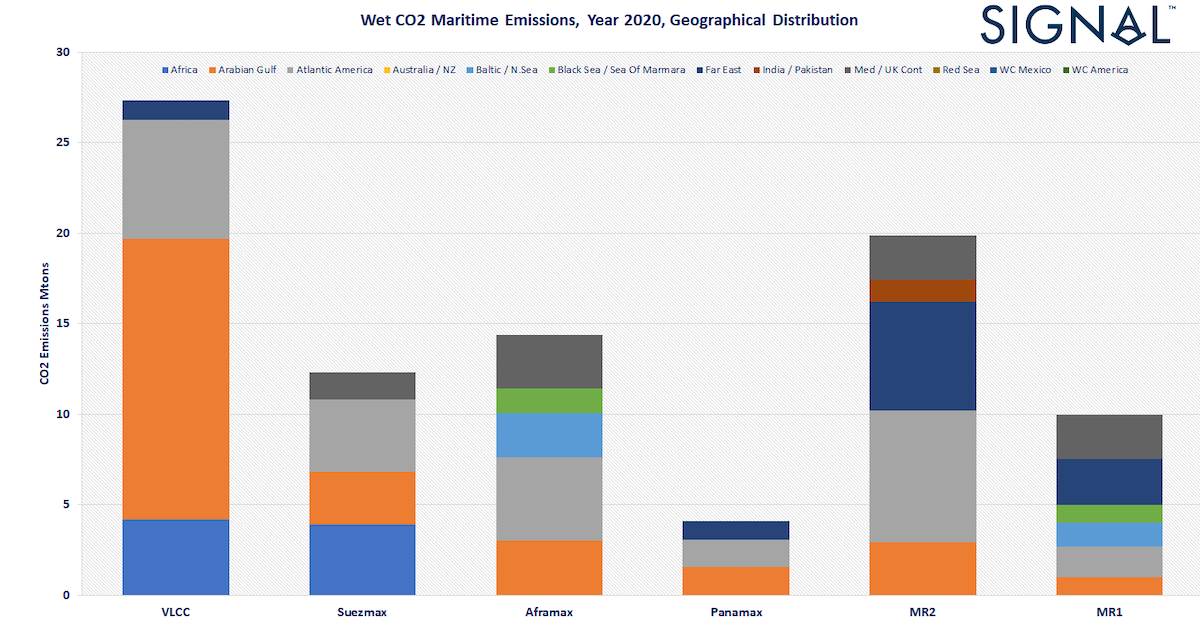
The below geographical distribution (Chart 1), using The Signal Ocean Platform data, demonstrates the level of CO2 maritime emissions for the year 2020, million tons per load area, for VLCC, Suezmax, Aframax fleets compared to Panamax and MR fleets. The same dataset can be used to aggregate information by segment, route or industry player (charterer or commercial operator), as a useful proxy to their comparative environmental performance. Such perspectives can enable participants to track and adjust their operational practices and decision making as they look to achieve the interim 2030 IMO objectives.

Triangulation is key
While we often consider the laden leg when we are thinking about CO2 emissions and the impact on the environment, the ballast leg has almost the same impact. Optimizing ballast legs has a different order of magnitude impact compared to Engine types, Age or Fuel. Of course there are trading routes that allow for higher levels of triangulation, therefore a reduction of emissions, and others that don’t. Typically the smaller the vessel-class, the higher the average triangulation and lower level of emissions. The below charts 2&3 with The Signal Ocean Platform data demonstrate the average triangulation time per vessel class and the level of shipping emissions. In Chart 3, we normalized CO2 emissions per ton mile to compare the average triangulation time and CO2 emissions between large and smaller ship sizes.
The figures for year 2020 indicate highest average triangulation time for MR2: 59% and MR1:57% (chart 2), however, taking into account cargo quantity transported and the number of voyages per vessel size, normalized CO2 per ton mile (chart 3) appear the lowest for MR2s and Aframaxes.

The impact of vessel speed on the reduction of CO2 emissions
The industry is used to adjusting the speed based on market conditions as shown at the chart 4 below. The commercial decision of vessel speed follows the volatility of the spot freight market and market expectations for future earnings. It is worth noting that establishing slow steaming could have a significant impact on the overall CO2 emissions. With The Signal Ocean Platform, users can navigate and monitor cases of CO2 savings in the ballast and laden leg of voyages adjusting vessel speed. We can say that with a 1 knot reduction in vessel speed in the laden leg, there is potential to save around 2 millions tons of CO2 on a yearly basis for tankers, however this can fluctuate with market conditions and is strongly influenced by the decisions of commercial operators as they navigate the challenges of supply and demand.

The steps for lower CO2 emissions transition
The establishment of alliances for zero emissions is a milestone for the industry and contributes to the development of green shipping. One of the most powerful alliances is the “Getting to Zero Coalition” . The coalition builds on the Call to Action in Support of Decarbonization launched in October 2018 and signed by more than 70 leaders from across the maritime industry, financial institutions and other stakeholders, as well as on the Poseidon Principles.
In June, the governments of Denmark, Norway and the United States, along with the Global Maritime Forum and the Mærsk Mc-Kinney Møller Center for Zero Carbon Shipping announced that they will lead a new Zero-Emission Shipping Mission as part of Mission Innovation. The target scope is to accelerate international public-private collaboration to scale and deploy new green maritime solutions, setting international shipping on an ambitious zero emission pathway. The mission will also be supported by the governments of India, Morocco, the U.K., Singapore, France, Ghana, and South Korea.
The international advisory panel on maritime decarbonization
Apart from the existence of above alliances for the transition to green friendly decisions, Singapore has emerged with a significant presence to smooth the procedure towards 2050.
The International Advisory Panel on Maritime Decarbonisation (IAP) formed in July 2020 by the Singapore Maritime Foundation (SMF), with the support of the Maritime and Port Authority of Singapore (MPA), has identified nine pathways for decarbonisation, including policy options to accelerate the transition and ways in which Maritime Singapore can support the industry’s decarbonisation. To achieve this vision, the IAP has recommended focusing on four strategic objectives: (1) harmonise standards; (2) implement new solutions; (3) finance projects; and (4) collaborate with partners.
IMO MEPC 76 concluding remarks
The MEPC 76 adopted amendments to the international Convention for the Prevention of Pollution from Ships (MARPOL) Annex VI that will require ships to reduce their greenhouse gas emissions. These amendments combine technical and operational approaches to improve the energy efficiency of ships, also providing important building blocks for future GHG reduction measures.
The new measures will require all ships to calculate their EEXI and establish their annual operational carbon intensity indicator (CII) and CII rating. Carbon intensity links the GHG emissions to the amount of cargo carried over distance travelled. Ships will get a rating of their energy efficiency (A,B,C,D,E - where A is the best). A ship rated D or E for three consecutive years is required to submit a corrective action plan to show how the required index would be achieved.
The amendments of MARPOL Annex VI are expected to enter into force on 1 November 2022, with:
- The Energy Efficiency Existing Ship Index (EEXI), applicable from the first annual, intermediate or renewal IAPP survey after 1 January 2023
- The operational Carbon Intensity Indicator (CII) rating scheme, taking effect from 1 January 2023
A review clause requires the IMO to review the effectiveness of the implementation of the CII and EEXI requirements, by 1 January 2026 at the latest, and, if necessary, develop and adopt further amendments.
Reduced fuel consumption and Emissions: The enhanced Ship Energy Efficiency Management Plan (SEEMP) stipulates that an approved SEEMP will need to be kept onboard from the 1st of January 2023. The IMO’s SEEMP (Ship Energy Efficiency Management Plan) guidelines suggest a variety of options to improve fuel efficiency – from speed optimisation, optimised weather routing to timely hull maintenance, engine load efficiency.
Decarbonization fund
Recognizing the R&D gap, the industry has proposed to the IMO a new, industry funded, research and development effort. The International Maritime Research and Development Board (IMRB) is a USD 5 billion program, governed by the IMO, to coordinate and fund applied R&D and prototype development to catalyse the introduction of zero-carbon fuels and technologies in the maritime sector. Studies show that this dramatic increase in funding would enable the development of commercially viable low-carbon/no-carbon ships by the early 2030s. Ten IMO Member States are currently co-sponsors of the IMRB proposal. ICS, which represents 80% of the world’s merchant fleet, has highlighted that growing uncertainty is leading to a reduction in confidence about R&D investment.
Carbon tax: A priority for the maritime industry
Several trade groups, representing more than 90% of the world’s merchant fleet, have submitted a proposal to shipping’s United Nations regulator calling for it to prioritize a carbon tax for the industry. There is a call from Maersk for a CO2 tax on marine fuels of at least $150/t, which would almost double the cost of VLSFO, while Trafigura has asked even higher at $250-$300/t. There is also a call for a $100/t a carbon dioxide tax by 2025, ratcheting up every five years, from the Marshall Islands and Solomon Islands. The discussion will resume at the Committee’s next session.
The roadmap to ‘’zero carbon bunker fuels”
Shipping’s fuel of the future must produce lower or zero emissions and also have enough power to support the voyages of large sized ships around the world. The fuel type must be storable, transportable and affordable. Shipowners are now weighing the pros and cons among ammonia, hydrogen, LNG, biofuels, methanol and nuclear.
The World Bank published in April the first report ‘’The Potential of Zero-Carbon Bunker Fuels in Developing Countries” and identified two alternative fuels, ammonia and hydrogen as the most promising for zero carbon bunker fuels for shipping. The second report, “The Role of LNG in the Transition Toward Low-and Zero-Carbon Shipping”, identifies that LNG will play a limited role in the decarbonization process, emphasizing its specific niche applications on pre-existing routes or in specific vessel types. The reports evaluate that by transitioning to zero carbon shipping many developing and developed countries, especially those with large renewable energy resources, can break into a future zero carbon fuel market. The report illustrated some present initial case studies for Brazil, India, Mauritius and Malaysia.
The World Bank underlines that zero carbon fuels will need to represent at least five percent of the bunker fuel mix by 2030 to put shipping on a GHG trajectory consistent with the Initial IMO GHG Strategy, as well as the Paris Agreement’s temperature goal.
The challenge for 2030 and 2050 milestones
The maritime industry faces an unprecedented challenge in complying with the IMO’s targets for decarbonization even before 2030 and 2050 as owners and charterers need to demonstrate that the vessels they buy and operate are high performers and that less efficient ships are subject to performance improvements. Shipyards too, will need to prioritise higher efficiency vessels and may have to improve their standard designs to achieve the minimum acceptable Carbon Intensity Indicator (CII) levels. The main focus so far has been on the impact of the Energy Efficiency Existing Ship Index (EEXI), however, CII could have a dramatic impact on the marketability of vessels as it creates a market mechanism for charterers, financiers and regulators to grade the performers. There is already an urgent call of action from shipping to governments for the acceleration of decarbonization with a welcomed fund for a USD 5 billion R&D to be led by a new International Maritime Research and Development Board (IMRB), with many nations stepping up to support the proposal. The next decade will revamp the maritime industry and scale up all the necessary steps for the transition to “Green Future’’.
This CO2 shipping market report for the evolution of reducing GHG emissions was produced using insights, data and reports from the Signal Ocean platform and other trustworthy sources.

