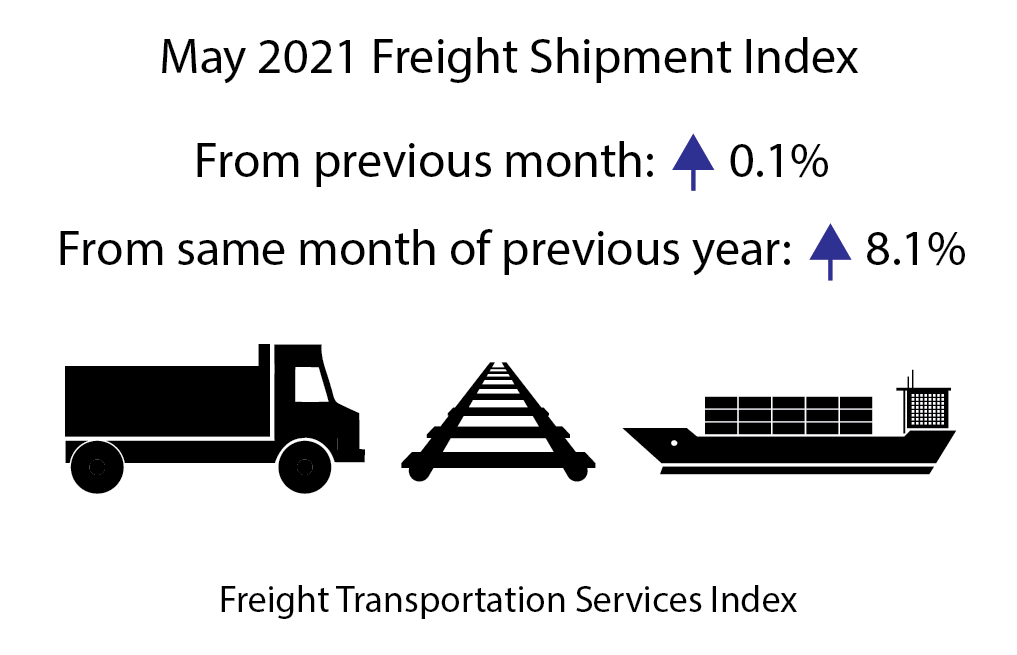
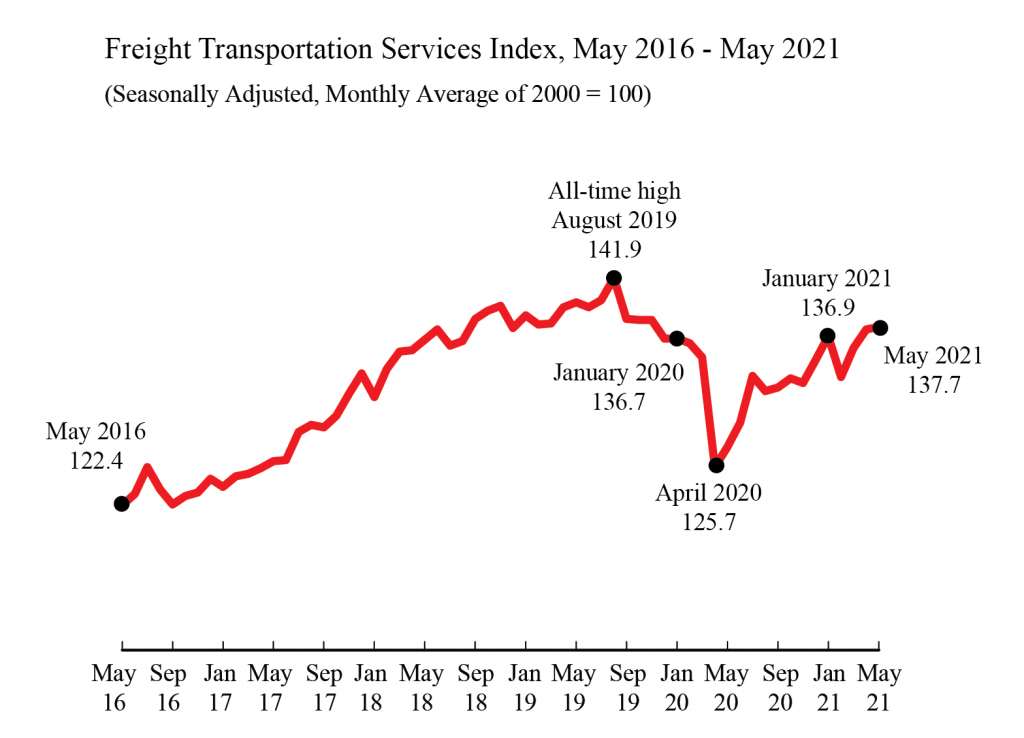
The level of for-hire freight shipments in May measured by the Freight TSI (137.7) was 3.0% below the all-time high level of 141.9 in August 2019 (Table 2A). BTS TSI records begin in 2000.
The April index was revised to 137.7 from 136.8 in last month’s release. January 2021 was revised up slightly; all other months in 2021 remain unchanged from last month’s release.
BTS is withholding the scheduled release of the passenger and combined indexes for May. The passenger index for May is a statistical estimate of airline passenger travel and other components based on historical trends up to April 2021. The statistical estimate does not fully account for the rapidly changing impacts of the coronavirus on the historical trend. Air freight for May is also a statistical estimate. Since air freight makes up a smaller part of the freight index, the freight TSI is being released as scheduled with the air freight estimate included. The April passenger and combined indexes are available on the BTS website.
The Freight TSI measures the month-to-month changes in for-hire freight shipments by mode of transportation in tons and ton-miles, which are combined into one index. The index measures the output of the for-hire freight transportation industry and consists of data from for-hire trucking, rail, inland waterways, pipelines and air freight. The TSI is seasonally-adjusted to remove regular seasons from month-to-month comparisons.
Analysis: The Freight TSI increased 0.1% in May from April due to seasonally-adjusted increases in rail carloads, air freight, truck and water despite declines in rail intermodal and pipeline. The May increase took place against the background of mixed results in other indicators from April to May.
The Federal Reserve Board Industrial Production (IP) Index grew 16.3% in April reflecting increases of 18.3% in manufacturing, 16.5% in mining, and 3.6% in utilities. Housing starts were down 3.0%. Personal Income decreased by 2.0%. The Institute for Supply Management Manufacturing (ISM) index was up 0.5 points to 61.2, indicating accelerating growth in manufacturing.
Although the May Passenger TSI is being withheld because of the previously cited difficulty of estimating airline passenger travel and other components, the April index is now being released. The index increased 2.8% from March to April following a decrease of 6.7% in March. Air passenger, rail passenger and transit all grew. The Passenger TSI remains above the levels of April 2020 through January 2021 though it has not returned to its level in March 2020, the last month before the impact of the pandemic. It remained below any level the Passenger TSI had been before the pandemic for the 14th consecutive month.
Trend: The May freight index increase was the third consecutive rise and the fifth increase in six months for a cumulative increase of 3.6% since November. The Freight TSI is above any level it attained during the COVID pandemic but is still below its level of November 2019. The index is 3.0% below its record level of 141.9 in August 2019 and has decreased in nine of the last 21 months since that peak. For additional historical data, go to TSI data.
Index highs and lows: For-hire freight shipments in May 2021 (137.7) were 45.1% higher than the low in April 2009 during the recession (94.9). The May 2021 level was 3.0% below the historic peak reached in August 2019 (141.9) (Table 1A).
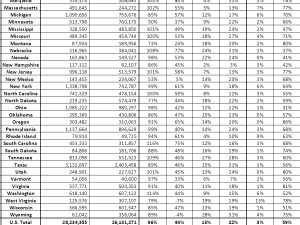
Year to date: For-hire freight shipments measured by the index were up 2.1% in May compared to the end of 2020 (Table 3).
Long-term trend: For-hire freight shipments are up 12.5% in the five years from May 2016 and are up 26.7% in the 10 years from May 2011 (Table 5).
Same month of previous year: May 2021 for-hire freight shipments were up 8.1% from May 2020 (Tables 4, 5).
The TSI has three seasonally-adjusted indexes that measure changes from the monthly average of the base year of 2000. The three indexes are freight shipments, passenger travel and a combined measure that merges the freight and passenger indexes. See Seasonally-Adjusted Transportation Data for numbers for individual modes. TSI includes data from 2000 to the present. Release of the June 2021 index is scheduled for Aug. 11.
Revisions: Monthly data has changed from previous releases due to the use of concurrent seasonal analysis, which results in seasonal analysis factors changing as each month’s data are added.
BTS research has shown a clear relationship between economic cycles and the Freight and Passenger Transportation Services Indexes. See a study of this relationship using smoothed and detrended TSI data. Researchers who wish to compare TSI over time with other economic indicators, can use the FRED database, which includes freight, passenger and combined TSI, and which makes it possible to easily graph TSI alongside the other series in that database. See TSI data on FRED.