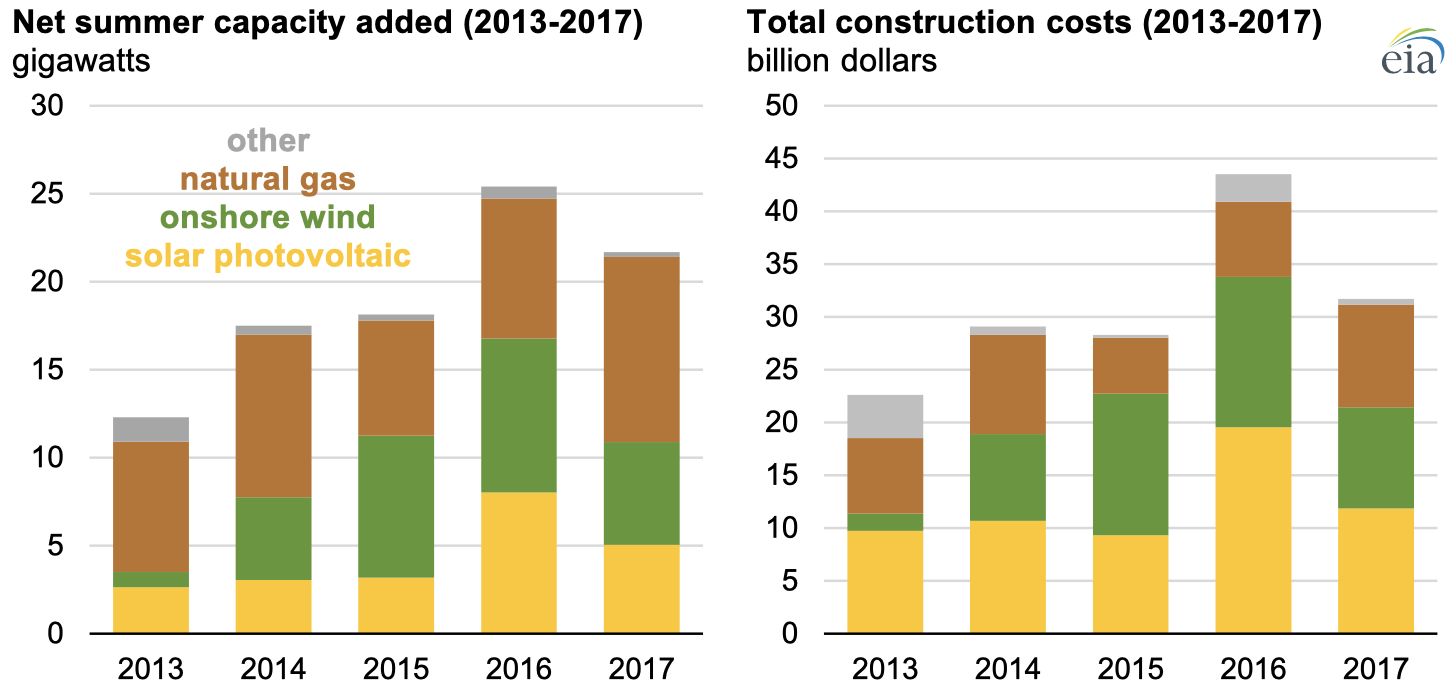
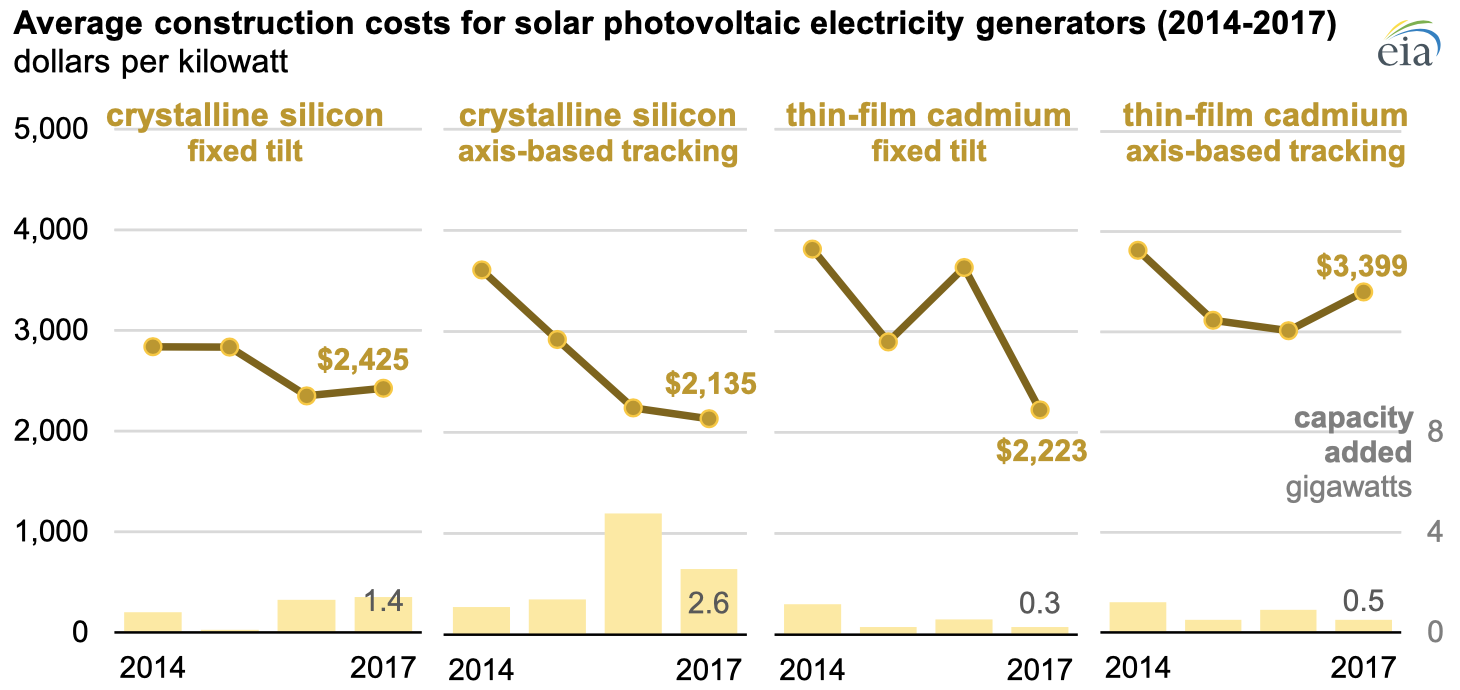
According to 2017 data from the U.S. Energy Information Administration (EIA) for newly constructed utility-scale electric generators in the United States, annual capacity-weighted average construction costs for solar photovoltaic systems continued to decrease. At the same time, costs for onshore wind turbines and natural gas generators increased slightly. These three generation technologies accounted for more than 97% of total capacity added to the grid in the United States in 2017. Since 2013, average costs for solar photovoltaic generators have fallen by 37%, wind by 13%, and natural gas by 4.7%. Total investment in U.S. electric generating capacity in 2017 decreased by 27% from the previous year.
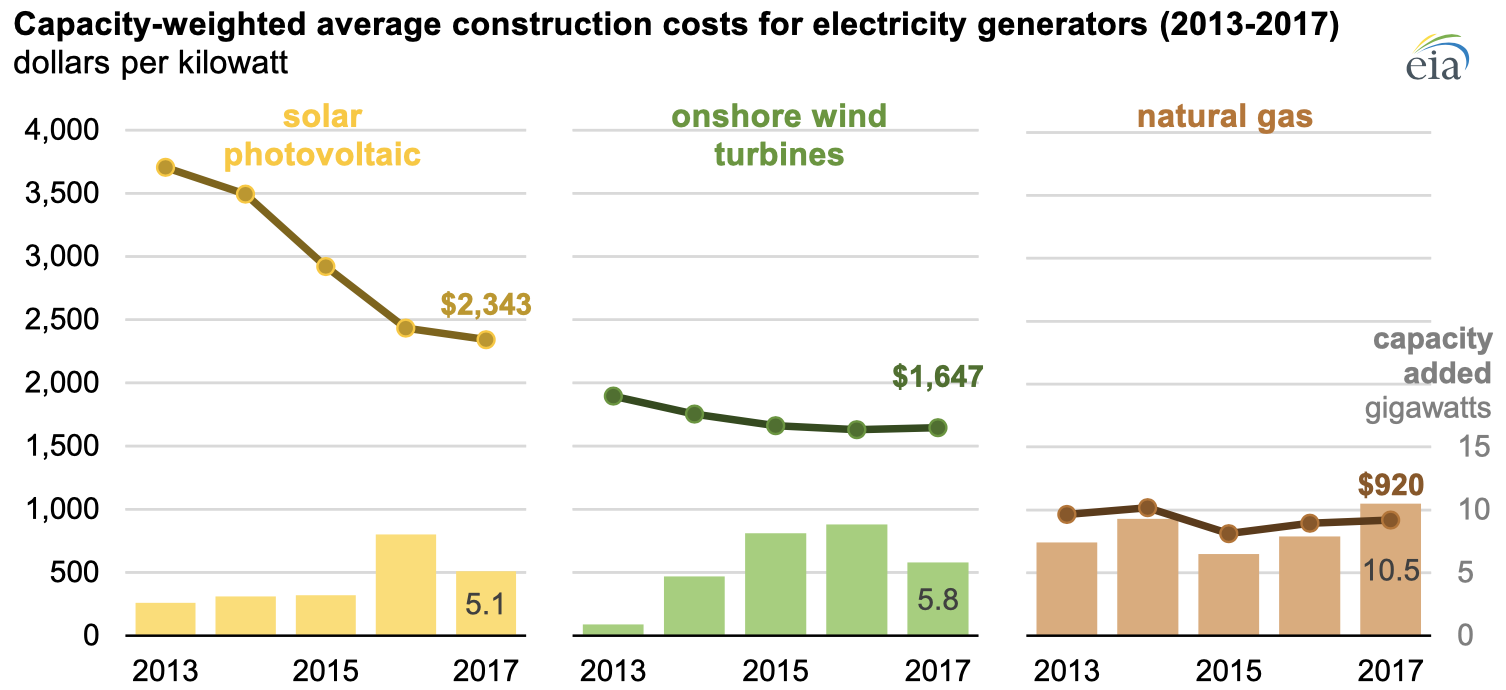
Solar photovoltaic generators generally cost more to install than wind and natural gas generators on a dollar-per-kilowatt basis. Solar photovoltaic generators accounted for a larger share of all new electricity generation construction costs in the United States in 2017, accounting for 37% of total investment. In 2017, U.S. developers spent nearly $12 billion in construction costs on solar photovoltaic plants and added 5.0 gigawatts (GW) of electricity generating capacity. By comparison, U.S. developers invested less in constructing natural gas and wind generators, but they still added 10.5 GW and 5.8 GW of capacity from those sources, respectively.
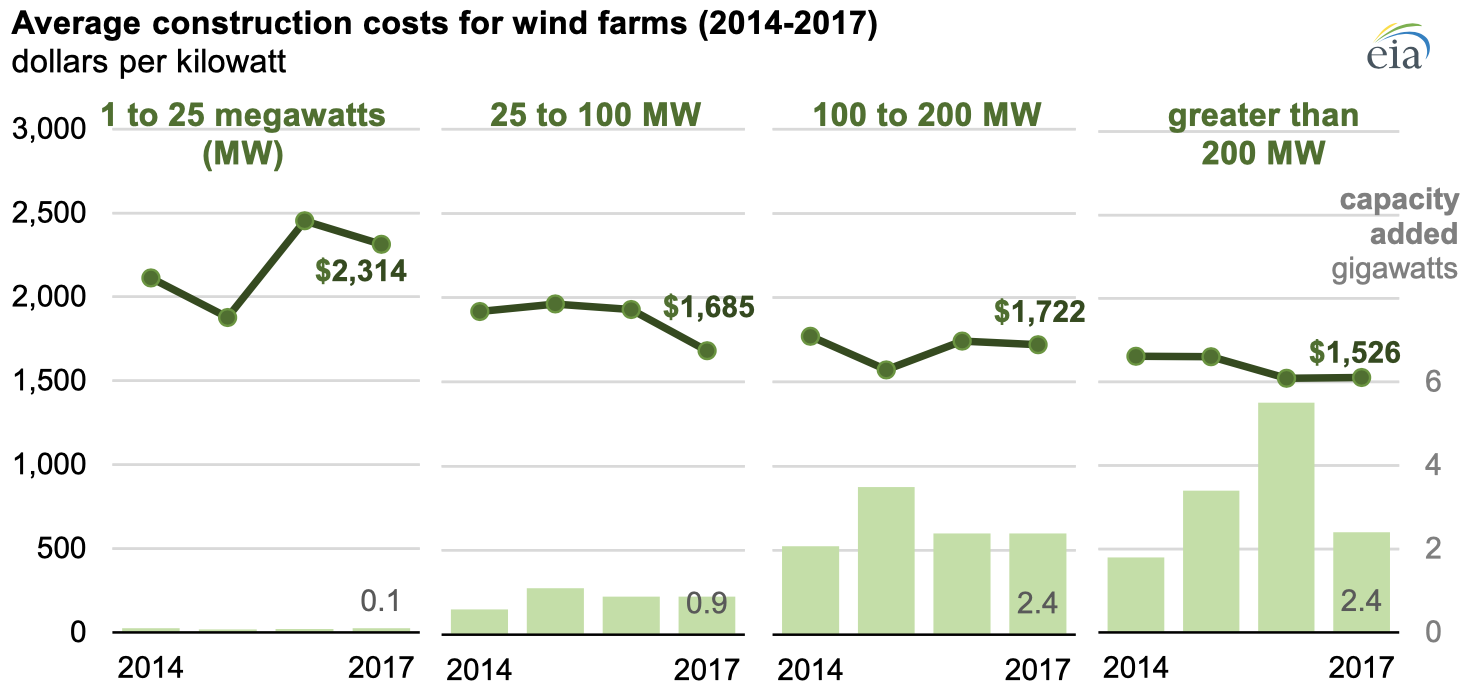
Total wind capacity additions were 34% lower for 2017, but average construction cost for onshore wind farms were relatively stable at $1,647/kW. Within different size classes, nearly every category had lower per-kilowatt costs in 2017, but average costs for all wind farms were similar to the 2016 average because fewer large farms were constructed in 2017.
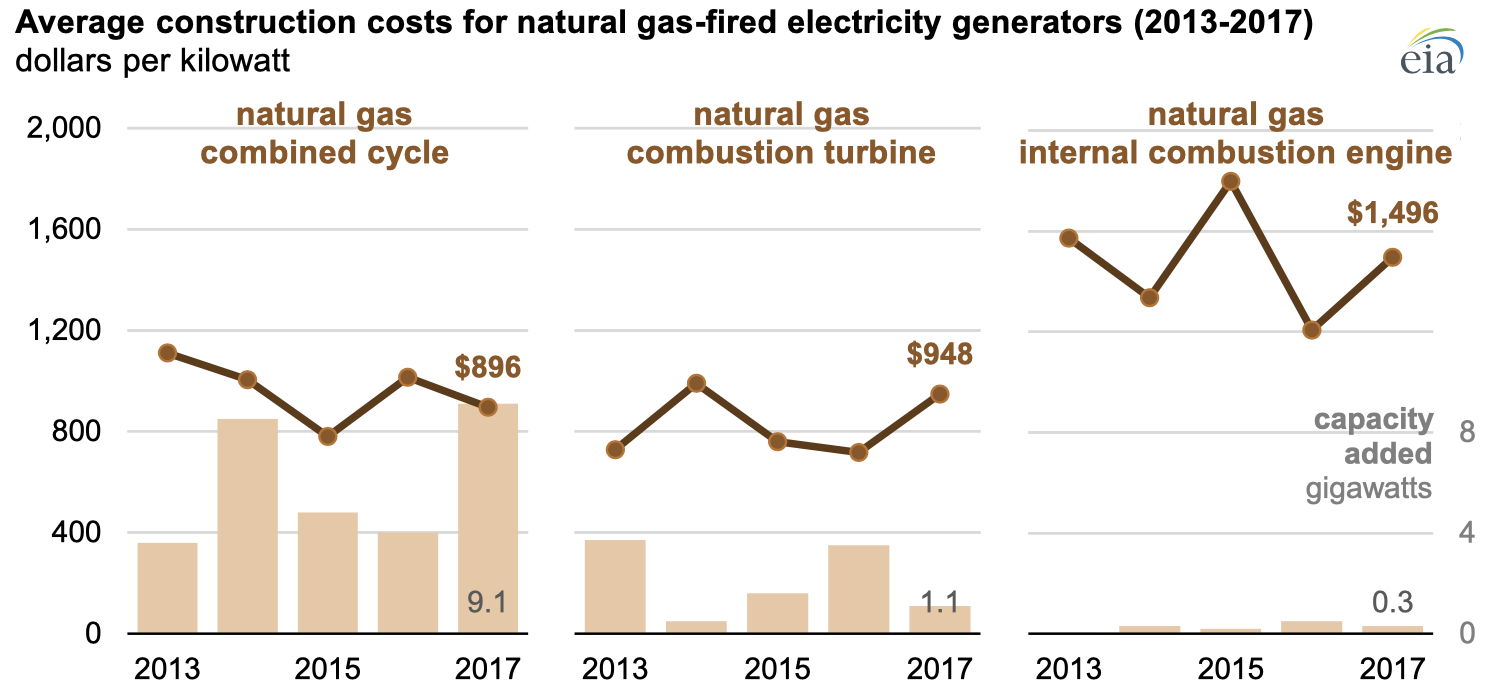
Unlike onshore wind and solar photovoltaics, which had less capacity installed in 2017 than in 2016, total natural gas electric generator capacity additions in the United States increased by 11% in 2017. The growth in natural gas electric generating capacity was led by significant additions in new capacity from combined-cycle facilities, which more than doubled in 2017. Although average combined-cycle technology construction costs fell by 11% in 2017 to $896/kW, total natural gas generator construction investment increased by 36% because of the increase in added capacity.
Principal contributor: Alex Mey


