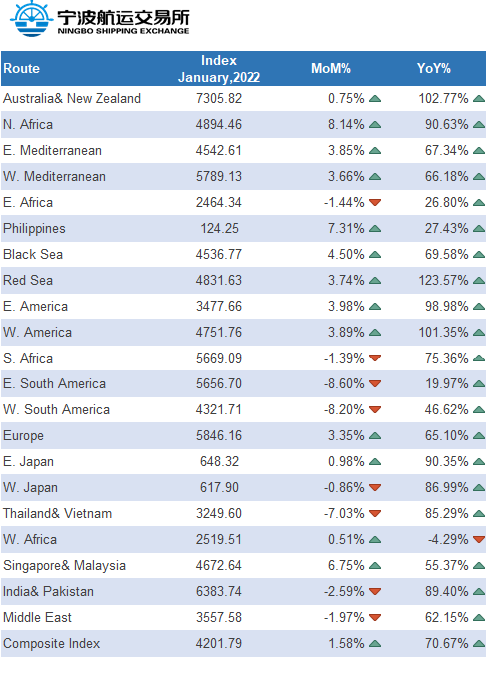
Ningbo Containerized Freight Index remains stable in January 2022
In 2021, the cargo volume of Chinese ports was 15545.3 million tons, a year-on-year increase of 6.8%; the container throughput of Chinese ports was 282.7 million TEU, a year-on-year increase of 7.0%. The chart below shows the cargo throughput and container throughput data of the twelve major ports in China.

Cargo Volume (in '0000 Tons) |
Containers Throughput (in '0000 TEUs) | |||||||
|---|---|---|---|---|---|---|---|---|
Port |
December |
YOY % |
January - December |
YOY % |
December |
YOY % |
January - December |
YOY % |
Dalian |
2655 |
6.4% |
31553 |
-5.5% |
32 |
39.1% |
367 |
-28.1% |
Tianjin |
3557 |
20.1% |
52954 |
5.3% |
106 |
-15.2% |
2027 |
10.4% |
Qingdao |
4612 |
-68% |
63029 |
4.3% |
184 |
-8.0% |
2371 |
7.8% |
Rizao |
4691 |
28.4% |
54117 |
9.1% |
38 |
-50% |
517 |
6.4% |
Lianyungang |
1969 |
6.9% |
26918 |
11.3% |
43 |
13.2% |
503 |
4.8% |
Shanghai |
5910 |
0.8% |
69827 |
7.3% |
398 |
9.3% |
4703 |
8.1% |
Ningbo&Zhoushan |
9930 |
12.4% |
122405 |
4.4% |
209 |
-6.7% |
3108 |
8.2% |
Xiamen |
2077 |
15.8% |
22756 |
9.7% |
104 |
4.0% |
1205 |
5.6% |
Shenzhen |
2449 |
-4.2% |
27838 |
5.0% |
253 |
-1.6% |
2877 |
8.4% |
Guangzhou |
5139 |
-1.7% |
62367 |
1.8% |
214 |
3.9% |
2418 |
4.4% |
Beibu Gulf |
3301 |
29.3% |
35822 |
21.2% |
62 |
21.6% |
601 |
19.0% |
Yinkou |
2021 |
-7.8% |
22997 |
-35% |
43 |
-10.4% |
521 |
-7.8% |


