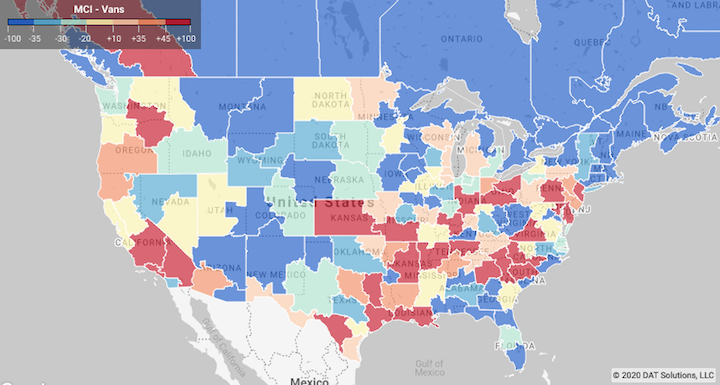
Spot truckload freight activity jumped last week as shippers and logistics companies began to reposition freight ahead of two major storms along the Gulf Coast, Laura and Marco.
The number of loads posted on the DAT One load board network increased 9% and truck posts ticked up 2% compared to the previous week, pushing national average spot rates to their highest levels since July 2018.

- Van: $2.20 per mile, 17 cents above the July average
- Flatbed: $2.28 per mile, up 8 cents
- Refrigerated: $2.43 per mile, up 13 cents
These rates are rolling averages for the month through August 23 and include a fuel surcharge.
Trends to Watch
Fuel prices: Hurricane Laura is forecast to reach the northwestern Gulf Coast along “Gasoline Alley,” a 375-mile stretch between Galveston, Texas, and New Orleans. This area is home to the single largest concentration of oil refineries and chemical plants in the country. In the weeks after Hurricane Harvey hit the Houston area in August 2017 and caused refineries to shut down, diesel and gasoline both rose more than 15 cents a gallon.
Repositioned freight: DAT’s 7-day Market Conditions Index shows high demand for truckload van capacity along the Gulf Coast as shippers looked to reposition freight ahead of two major storms last week. The biggest price increase on the top 100 van lanes by volume last week was the lane from Houston to New Orleans, where the average rate rose 17 cents to $3.19 per mile.
Port traffic is curtailed: The ports of Houston and New Orleans anticipate closures through Thursday as Hurricane Laura makes landfall. Houston handles nearly 70% of all Gulf Coast container traffic.
Volumes tumble on major van lanes: Average spot van rates were higher on 58 of DAT’s top 100 lanes by volume but the number of loads moved on those lanes fell 30.4%. Despite declining volumes, spot van rates were up out of several key markets compared to the previous week:
- Houston: $2.10, up 2 cents
- Chicago: $2.55 per mile, up 8 cents
- Memphis: $2.73, up 3 cents
- Los Angeles: $3.23, up 4 cents
- Columbus, Ohio: $2.74, up 7 cents
Van rates are still high: Spot van rates are at the highest level seen in the past five years for mid-August and currently up 25% year over year. DAT’s Ratecast predictive model expects van rates to plateau in the $2.00 to $2.05 per mile range over the next four weeks.
Reefer rates increase: Average spot reefer rates were higher on 37 of DAT’s top 72 lanes by volume on a 10.7% decline in the number of loads moved on those lanes. Rates were neutral on 26 lanes and lower on seven lanes compared to the previous week. Two notable lanes:
- Dallas to Columbus rose 23 cents to $2.45 a mile, reflecting shifts in supply chains.
- Elizabeth, N.J., to Boston remained at an average of $5.23 a mile for the second week in a row.
Harvest shipments are winding down: The U.S. Dept. of Agriculture reported that seasonal truckloads of domestic produce decreased by 3% last week and 12% for imported truckload shipments, which is just under 2,500 fewer loads of produce compared to the same week in 2019.
Bullish on flatbeds: As strong as spot market demand and rates have been recently for vans and reefers, the longer-term outlook for flatbeds is more bullish. As a weekly average, the national flatbed load-to-truck ratio was 42.2, touching above 40 for the first time since the week of July 21, 2018. That’s on the strength of new home construction, which jumped up 23% in July, according to the U.S. Census Bureau. Building permits also rose by 19% in July, fueled by low interest rates. All of these are positive indicators for future building activity, which will create more demand for flatbeds.
FEMA loads: The U.S. Federal Emergency Management Agency approved a preemptive disaster declaration ahead of Laura making landfall. To learn more about FEMA loads and emergency freight on the spot market, visit dat.com/industry-trends/emergency-freight.
DAT operates DAT One, the largest truckload freight marketplace in North America. The company’s DAT iQ analytics group delivers market trends and data insights derived from 183 million freight matches and a database of $118 billion of market transactions. For the latest information visit dat.com/trendlines and find DAT Market Insights at dat.com/blog/category/market-update, the DAT Freight Talk blog, the DAT Facebook page, or @LoadBoards on Twitter. Stay safe.


