Rates, volumes increase as shippers use the spot market to resolve imbalances in their freight networks
Bucking seasonal trends, the surge continues in spot market rates across all equipment types, according to DAT Freight & Analytics, which operates the industry’s largest online marketplace for spot truckload freight.
Van, reefer and flatbed volumes and rates all ended up positive month over month.
“States are reopening at different rates and are being hit by the virus at different times. This is leading to unseasonal peaks and valleys in manufacturing output and consumer demand,” said Ken Adamo, Chief of Analytics at DAT. “Carrier networks are out of balance due to inconsistent freight demand at a commodity and lane level, and this is leading to a spike in demand for spot freight in order to meet the capacity need.”
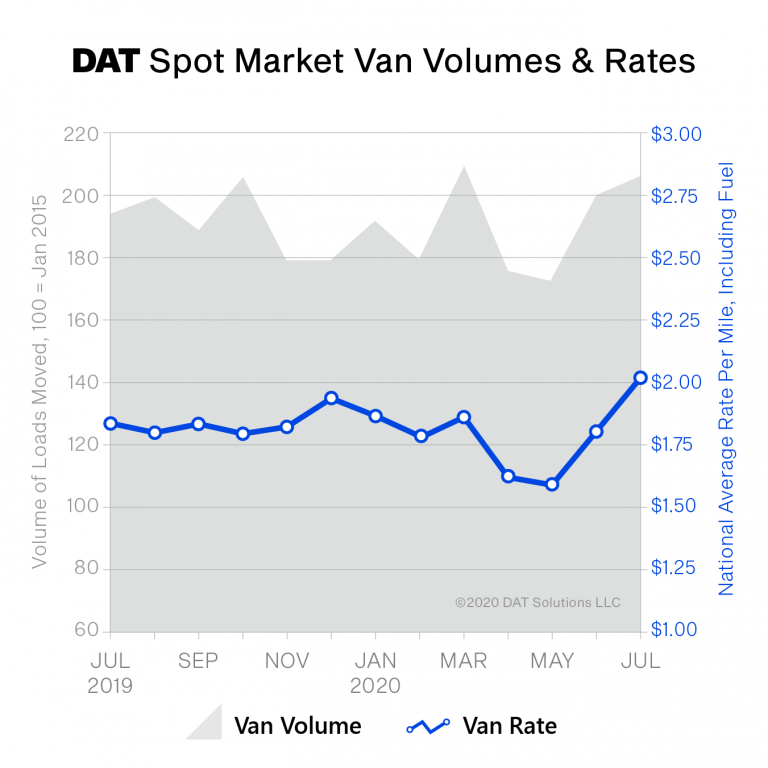
Nationally, the July load-to-truck ratio for vans was up for the third straight month to 4.4, up 25% from last month. The ratio was more than double the July 2019 number (2.1), indicative of a market with more freight than trucks posted on the DAT network. Spot van rates averaged $2.03 per mile nationally, up 23 cents compared to June and 19 cents higher versus July 2019.
Spot reefer volumes were up less than 1 percent month-over-month. The reefer load-to-truck ratio was 7.4, four times higher than April’s all-time low of 1.7 loads per truck. The national average reefer spot rate was $2.30 per mile, up 15 cents compared to June, and 11 cents higher year-over-year.
Construction activity remains strong, contributing to a national flatbed load-to-truck ratio of 24.8 in June, the highest number since July 2018. July flatbed volume was steady compared to June and down 6.6 percent compared to July 2019 numbers. The national average flatbed spot rate was $2.20 per mile, 13 cents more than June but 7 cents lower than July 2019.
DAT Freight Outlook: Higher Van, Reefer Rates in the Forecast
National van and reefer spot rates are forecasted to increase through the end of August. Flatbed rates are uncertain in August, but carriers can expect ongoing demand in construction, specifically for standard framing dimension softwood lumber used in new home construction.
Consumer spending, which makes up close to 70% of the U.S. economy, will have a large impact on the freight market in August and September. This in turn will be affected by federal stimulus efforts.
“The entire supply chain is being forced to adapt to changes in consumer buying patterns, which affects everything from the equipment types needed for delivery to warehousing capacity,” Adamo said. “Increased online shopping is here to stay and shippers and carriers alike are being forced to adjust.”


