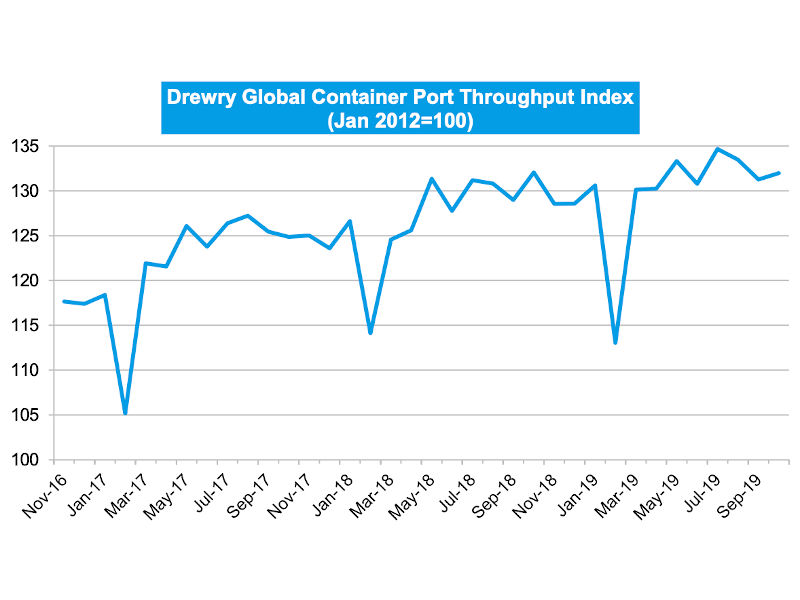
The Drewry Container Port Throughput Indices are a series of volume growth/decline indices based on monthly throughput data for a sample of over 220 ports worldwide, representing over 75% of global volumes. The base point for the indices is January 2012 = 100.

Drewry’s latest assessment - December 2019
North America saw the largest annual decline of any region in October 2019. The throughput index was at 144 points, nearly 5% lower than October 2018. However it was 3.3 points up compared to September 2019. Last year the region outperformed in this period due to tariff increase fears which resulted in some advance cargo bookings. The index for October 2018 was an historic high of 151 points. Meanwhile Latin America experienced a 4% monthly and 3.5% annual decline in October 2019.
The index for China further deteriorated to 139 points, seeing a 2.8% monthly decline in October 2019. However it was close to 1% higher than the October 2018 level.
Asia excluding China outperformed all other regions in terms of monthly increase, with the throughput index being 5.5 points up (4.4%) in Oct 2019. This may be due to relocation of sourcing from China to Southeast Asia due to the tariff war. However the annual increase was less than 1%.
On an annual basis, the index for Europe was little changed compared with October 2018. However on a monthly basis, it was 3.2% higher compared to September 2019.
The throughput index for Africa was down by 1.2 points (1.2%) compared to September 2019 but the annual decline was slightly greater at 2.5 points. However, the index figures for Africa are based on a relatively small sample.
* Note that the index figures for Africa are based on a relatively small sample, and should be viewed with caution
# All index figures for October 2019 are preliminary, subject to change next month


_-_127500_-_8a318468216421556cdca53a3734a9780c23cb29_lqip.jpg)


