Global chargeable weight in February 2020 fell - on a like-for-like basis - by nearly 9% versus 2019 as the air cargo industry suffered the dramatic consequences of the novel coronavirus on world trade.

Market analyses by CLIVE Data Services for last month shows that conducting a basic year-on-year comparison of airfreight volumes would have produced a decline of close to 2%. However, adjusting the analyses for the fact that the Chinese New Year fell early this year (-3%) and the fact that February 2020 is a Leap Year, with an extra day over the same month a year ago (-4%), takes the overall decline to close to -9%.
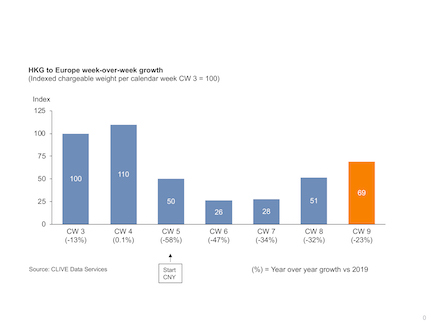
Looking in further detail at the Hong Kong market, February’s data reveals the return to a more ‘normal’ dynamic load factor picture This, however, is more related to the capacity taken out of the market by airlines than a surge in demand. Air cargo volumes out of Hong Kong are still 30% below their level post Chinese New Year and 23% less than in the same week of last year. On a more positive note, the step-by-step growth in chargeable weight does indicate that Chinese demand for cargo capacity is showing the early signs of shifting gear.
The dynamic load factor for February 2020 of 65% was down 1% year-on-year but 3% higher than in January.
CLIVE’s Managing Director, Niall van de Wouw said: “If ever there was a moment when we can highlight the limitations of basic month-on-month analyses from a methodology standpoint, this is it. While all three analyses are correct by themselves, it is our opinion that the near -9% decline in February is the best ‘temperature reading’ of the state of the global air cargo industry. Without the normalisation of the data we have applied, the picture is skewed.”
CLIVE’s first-to-market analyses each month consolidates data shared by a representative group of international airlines operating to all corners of the globe. Based on both the volume and weight perspectives of the cargo flown and capacity available, it gives the air cargo industry the earliest possible barometer of market performance each month.


