New for this week, we've added several new data points and charts to our market report data sheet, including rolling annualized volatility on all lanes. This will help air freight market players judge the relative volatility of aggregate and basket lanes and provide a risk profile for business along these lanes.
Additionally and at the request of clients, we've added the spread value (the difference between two corresponding indices) for several China to US and Europe lanes. You might for example, use the China to EUR vs USA spread to hedge any growing impact of trade tariffs on trans-Pacific trade.
Finally, we've added a useful week-on-week price change graph, providing a good indication as to momentum of the market versus the actual price. Please let us know your feedback on these changes.
Trading Update
Highlighting the ongoing divergence between China to Europe and China to USA, spreads Decrease to 30 cents as China to Europe continues a slight gain, and China to USA slides a further 7 cents.
Shanghai persists with rate gains into Europe, up a further 13 cents however trans-Pacific trade is hit through both Hong Kong and Shanghai export airports. Interestingly, Hong Kong to US rebounds slightly, up 6 cents, however this does not offer any sense of lane recovery for this year.
The Air Index Average drops 2 cents, reflecting a general drop-off in the first week of December, whilst forward curves rationalise up to final month prices ($3.14 to Europe and $3.44 to USA). Importantly, China to USA 2020 prices continue to slide below 2019 levels, whilst China to Europe is bolstered slightly, down only 2 cents.
Market Comment
Converging for a second week running, China to Europe continues a slower gain in price, whilst China to US extends its premature decline in freight price. Our previous comments about hope of immediate support for this lane ringing true, as carriers and forwarders alike reel from a substantial decline in freight volume.
One of our new report features, the Air Index (an average of all TAC Index routes) shows what we all think, a further decline at the back end of the Q4 peak season. What is even more stark is the volatility of this average route index, a whopping 44%.
Unfortunately, very little is certain in this crucial preparatory stage for shipper tenders and BSA negotiations between airlines and forwarders. A large number of airfreight businesses judge that in the second half of 2020, 'something', will happen (who knows what this 'something' might be!). Perhaps this is wishful thinking, for a market that will see air freight businesses and airlines disappear should 2019 conditions persist through to the end of 2020.
And an interesting side note for us, IMO2020 costs have already started to impact underlying freight rates, and you may well expect airline fuel surcharge mechanisms to follow. Crack spreads between Brent Crude and Jet Kerosene widen as middle distillate's show chances of supply strain. For all we know, 2020 might also be the first time we see a live indexing of fuels positive (or negative, depending on your viewpoint) impact on the air freight rate.
General wisdom mandates use of FIS AFFA contracts to secure long term contracts for 2019, whilst the Westerners amongst us will be wishing for world peace and an airfreight market recovery this Christmas. Please feel free to ask us how to do either of these!
| Basket | USD/KG | CHANGE | CHANGE % | MTD | VOL % |
| CHINA - EUR | 3.23 | 0.03 | 0.94% | 3.23 | 23.15% |
| CHINA - USA | 3.53 | -0.07 | -1.94% | 3.53 | 25.05% |
| Blended | USD/KG | CHANGE | CHANGE % | MTD | VOL % |
| PVG/EUR | 3.19 | 0.13 | 4.25% | 3.19 | 29.37% |
| HKG/EUR | 3.28 | -0.06 | -1.80% | 3.28 | 33.57% |
| PVG/US | 3.29 | -0.20 | -5.73% | 3.29 | 30.37% |
| HKG/US | 3.78 | 0.06 | 1.61% | 3.78 | 35.69% |
| Global | USD/KG | CHANGE | CHANGE % | MTD | VOL % |
| Air Index | 2.40 | -0.02 | -0.35% | 2.40 | 44.43% |

| Lane Pairs | Spread | Ratio |
| CHINA - EUR vs USA | 0.30 | 11.26% |
| HKG vs PVG - EUR | 0.09 | 35.94% |
| HKG vs PVG - USA | 0.49 | 7.21% |
Forward Curve - Indicative Update
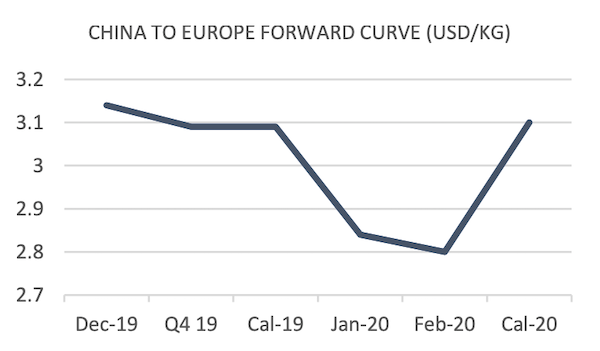
| FIS AFFA, CHINA - EUROPE | USD/KG | ||||
| BID | ASK | VALUE | CHANGE | |
| Dec-19 | 3.10 | 3.18 | 3.14 | 0.10 |
| Q4 19 | 3.06 | 3.12 | 3.09 | 0.03 |
| Cal-19 | 3.06 | 3.12 | 3.09 | 0.04 |
| Jan-20 | 2.77 | 2.89 | 2.83 | 0.01 |
| Feb-20 | 3.07 | 3.17 | 2.80 | 0.00 |
| Cal-20 | 3.05 | 3.15 | 3.10 | -0.02 |
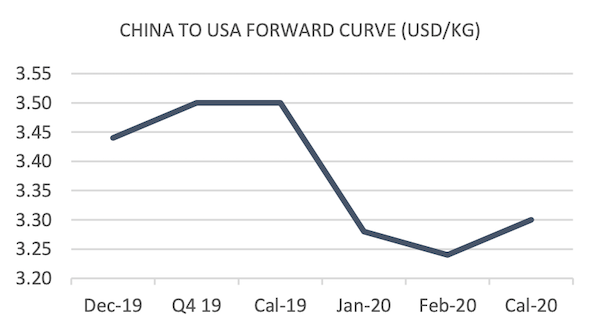
| FIS AFFA, CHINA - USA | USD/KG | ||||
| BID | ASK | VALUE | CHANGE | |
| Dec-19 | 3.40 | 3.48 | 3.44 | 0.06 |
| Q4 19 | 3.46 | 3.54 | 3.50 | 0.00 |
| Cal-19 | 3.46 | 3.54 | 3.50 | 0.02 |
| Jan-20 | 3.21 | 3.35 | 3.28 | 0.00 |
| Feb-20 | 3.30 | 3.50 | 3.24 | 0.00 |
| Cal-20 | 3.20 | 3.40 | 3.30 | -0.10 |