Trading Update
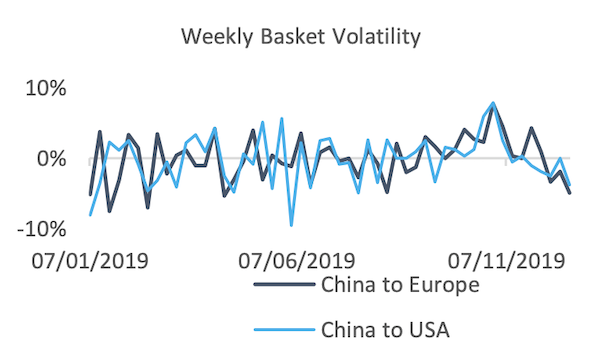
China to Europe versus US spreads decrease as the softer decline in China to US rates (still down another 13 cents this week) is matched by an equal decline from China to Europe (down 15 cents).
Front month and quarter prices fall on both forward curves, down 8 and 2 cents respectively. Interestingly Cal 20 China to Europe is now priced at $2.90 off of the back of fixed contract hedging, losing 15 cents off of its previous value.
Market Comment
In classic 2019 market style, the spot prices for 23rd December flash up in a sea of red, welcoming in the Holiday period and the New Year in dismal fashion. the majority of the core Asia lanes are down, reflective of seasonality - however we should all watch out and see how far this rate drop actually goes given TAC Index showed a temporary inflation of rates in Q1 2019 in order to set up high BSA rates.
As others have noted, fundamentals are slowly shifting for 2020 - trade wars are set to resolve (although much of this appears to rely on Trump's activity on his Twitter account), Brexit appears to be laid in, and inventory cycling appears to be at a recovery point. As usual we end up with a highly peculiar and uncertain set of macro-economic and geo-political conditions that remove any sense of comforting certainty.
What is certain, survival will be the name of the game for a number of freight businesses and airlines, Q1/2 2020 might well test the pain tolerance for airlines especially as the guaranteed portion of our market slips away.
| Basket | USD/KG | CHANGE | CHANGE % | MTD | VOL % |
| CHINA - EUR | 2.91 | -0.15 | -4.90% | 3.08 | 23.19% |
| CHINA - USA | 3.31 | -0.13 | -3.78% | 3.43 | 24.90% |
| Blended | USD/KG | CHANGE | CHANGE % | MTD | VOL % |
| PVG/EUR | 2.74 | -0.12 | -4.20% | 2.94 | 29.99% |
| HKG/EUR | 3.08 | -0.17 | -5.23% | 3.22 | 33.21% |
| PVG/US | 3.14 | -0.17 | -5.14% | 3.27 | 30.08% |
| HKG/US | 3.49 | -0.08 | -2.24% | 3.59 | 35.90% |
| Global | USD/KG | CHANGE | CHANGE % | MTD | VOL % |
| Air Index | 2.39 | 0.00 | 0.00% | 2.40 | 44.29% |
| Lane Pairs | Spread | Ratio |
| CHINA - EUR vs USA | 0.40 | 7.77% |
| HKG vs PVG - EUR | 0.34 | 8.56% |
| HKG vs PVG - USA | 0.35 | 9.47% |
| Airfreight Route (AR) | Description | USD/KG | CHANGE | CHANGE % | MTD | VOL % |
| AGR 1 | HKG to LAX & ORD & JFK | 3.56 | -0.07 | -1.93% | 3.44 | 46.85% |
| AGR 2 | HKG to LHR & FRA & AMS | 3.21 | -0.07 | -2.13% | 2.78 | 40.27% |
| AGR 3 | HKG to SIN & BKK & PVG | 1.14 | 0.01 | 0.88% | 1.17 | 27.00% |
| AGR 4 | PVG to AMS & FRA & LHR | 2.79 | -0.18 | -6.06% | 2.60 | 45.35% |
Forward Curve - Indicative Update
| FIS AFFA, CHINA - EUROPE | USD/KG | ||||
| BID | ASK | VALUE | CHANGE | |
| Dec-19 | 3.02 | 3.10 | 3.06 | -0.08 |
| Q4 19 | 3.02 | 3.10 | 3.06 | -0.08 |
| Cal-19 | 3.02 | 3.10 | 3.06 | -0.08 |
| Jan-20 | 2.78 | 2.90 | 2.84 | 0.00 |
| Feb-20 | 2.66 | 2.86 | 2.76 | 0.00 |
| Cal-20 | 2.80 | 3.00 | 2.90 | -0.15 |

| FIS AFFA, CHINA - USA | USD/KG | ||||
| BID | ASK | VALUE | CHANGE | |
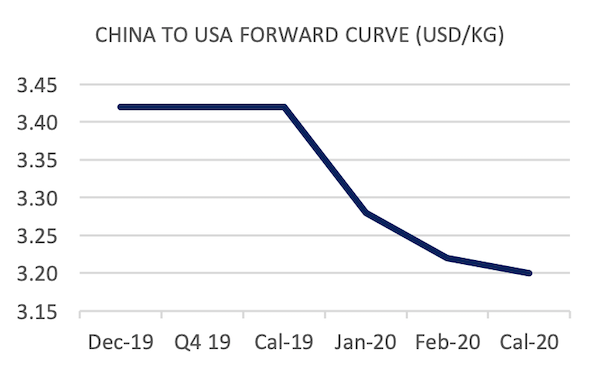
| Dec-19 | 3.40 | 3.44 | 3.42 | -0.02 |
| Q4 19 | 3.40 | 3.44 | 3.42 | -0.02 |
| Cal-19 | 3.40 | 3.44 | 3.42 | -0.02 |
| Jan-20 | 3.21 | 3.35 | 3.28 | 0.00 |
| Feb-20 | 3.28 | 3.48 | 3.22 | 0.00 |
| Cal-20 | 3.10 | 3.30 | 3.20 | -0.05 |

-and-William-Lee-of-SF-Airlines-_-_127500_-_b76515ad8a48b365160a898b41931f2909db40fe_yes.png)


