**INDEX NOTICE** | due to severe reductions in airfreight volume from Asia due to nCoV quarantine, transaction data available for index market rates is limited.
Trading Update
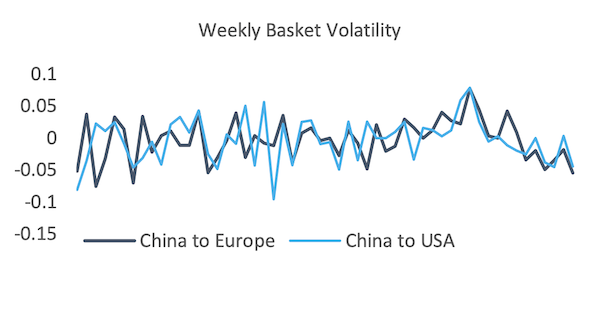
Basket lanes from China to Europe and China to USA soften volatility slightly, however the spreads widen substantially across airport to region pairings, Hong Kong vs Shanghai to Europe into negative territory once again (-0.18) and the Hong Kong vs Shanghai to USA spread widening to a recent record (0.68).
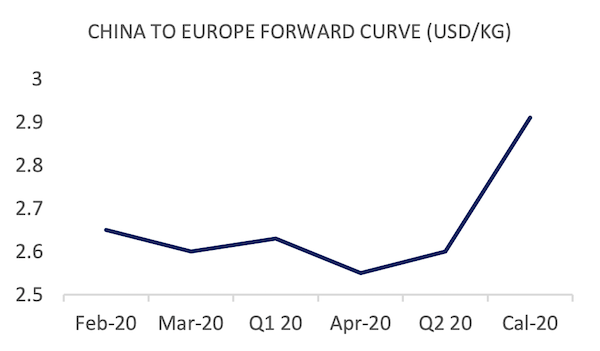
Front month forward curve prices reflect the near term confusion between trade lanes, China to Europe gaining 5 cents and trailing with an extra 4 cents gain on March 2020. China to USA loses 7 cents on the front month, whilst gaining 4 cents in March 2020 on the back of rate confidence.
Market Comment
Factors have collided as we start seeing the pricing impact of coronavirus quarantine measures on Asia airfreight capacity. As we note above, and indicative of the limited air cargo throughput out of Asia last week, index transactional data is very thin increasing the noise and volatility of prices on the smaller amount of transactions taking place. Charters have largely dominated any inbound traffic, however a backlog of airfreight capacity orders has yet to materialise, restricting volumes leaving China.
In an attempt to take a purely data driven approach to analysis here, control of movement into and out of Hong Kong and mainland China, and the limitations on domestic trucking in China have appeared to favour Shanghai as a primary export point for European destinations. Conversely, the travel bans from China to US have favoured Hong Kong in the immediate term, severely damaging the strength of Shanghai to US pricing. However the lack of cargo moving into and out of China makes us cautious to set up an immediate assessment, as the majority of business revenues are unlikely to track index volatility until industrial production and movement of freight resumes at some point in the coming weeks.
In simple terms the bulk of cash flow will not start moving to buy and sell airfreight capacity at inflated/deflated prices, until cargo is available to be moved. The diversity of price increases and declines is indeed quite surprising, however reflecting the comments of many major freight forwarding veterans over the past few days, any degree of predictability is unlikely over the next few weeks. There is a near term guarantee of supply chain bottlenecks, pushing the skill and efficiency of the logistics market to clear the impending backlog in what Bloomberg has called the 'nightmare for global tech'. The technology sector is one of many to be affected, the freeze of regional and global automotive supply chains has also been in the spotlight.
Chinese backstops in the form of support for equities give a sense as to the measures The CCP will take to recover damage to the Chinese economy, however a fall in fiscal revenue growth (3.8% in 2019, 6.2% in 2018) has been slated to limit the scale of any stimulus package. Manpower will appear to remain as a significant problem in line with the scope of quarantine measures.
All the while, the time-frame for sea and airfreight capacity to the market is still reasonably uncertain, with reviews on-going at most major airlines (including freighter operators such as AirBridgeCargo, Cargolux, Lufthansa who have restricted capacity). All eyes will be on how quickly air and sea carriers can muster capacity to provide suitable uplift for any freight volume spike, and how substantial and quantifiable this volume spike might be.
| Basket | USD/KG | CHANGE | CHANGE % | MTD | VOL % |
| CHINA - EUR | 2.60 | 0.08 | 3.17% | 2.56 | 40.48% |
| CHINA - USA | 2.89 | -0.12 | -3.99% | 2.95 | 19.17% |
| Blended | USD/KG | CHANGE | CHANGE % | MTD | VOL % |
| PVG/EUR | 2.69 | 0.33 | 14.00% | 2.52 | 63.61% |
| HKG/EUR | 2.51 | -0.18 | -6.69% | 2.60 | 26.41% |
| PVG/US | 2.55 | -0.44 | -14.70% | 2.77 | 34.48% |
| HKG/US | 3.23 | 0.03 | 6.60% | 3.13 | 27.61% |
| Global | USD/KG | CHANGE | CHANGE % | MTD | VOL % |
| Air Index | 2.13 | -0.03 | -0.53% | 2.14 | 49.63% |
| Airfreight Route (AR) | Description | USD/KG | CHANGE | CHANGE % | MTD | VOL % |
| AGR 1 | HKG to LAX & ORD & JFK | 2.99 | -0.08 | -2.60% | 2.99 | 35.28% |
| AGR 2 | HKG to LHR & FRA & AMS | 2.74 | -0.02 | -0.72% | 2.74 | 30.48% |
| AGR 3 | HKG to SIN & BKK & PVG | 1.18 | 0.03 | 2.61% | 1.18 | 26.33% |
| AGR 4 | PVG to AMS & FRA & LHR | 2.87 | 0.00 | 0.00% | 2.87 | 73.53% |
Forward Curve - Indicative Update
| FIS AFFA, CHINA - EUROPE | USD/KG | ||||
| BID | ASK | VALUE | CHANGE | |
| Feb-20 | 2.55 | 2.75 | 2.65 | 0.05 |
| Mar-20 | 2.56 | 2.64 | 2.60 | 0.04 |
| Q1 20 | 2.53 | 2.65 | 2.63 | 0.04 |
| Apr-20 | 2.45 | 2.65 | 2.55 | 0.00 |
| Q2 20 | 2.59 | 2.72 | 2.60 | 0.00 |
| Cal-20 | 2.71 | 3.11 | 2.91 | 0.00 |
| FIS AFFA, CHINA - USA | USD/KG | ||||
| BID | ASK | VALUE | CHANGE | |
| Feb-20 | 2.82 | 2.99 | 2.91 | -0.07 |
| Mar-20 | 2.99 | 3.09 | 3.04 | 0.04 |
| Q1 20 | 2.93 | 3.05 | 2.98 | -0.01 |
| Apr-20 | 2.85 | 3.05 | 2.95 | 0.00 |
| Q2 20 | 2.92 | 3.12 | 3.02 | 0.00 |
| Cal-20 | 2.95 | 3.15 | 3.05 | |

-and-William-Lee-of-SF-Airlines-_-_127500_-_b76515ad8a48b365160a898b41931f2909db40fe_yes.png)


_N434AS_approaching_Newark_Liberty_International_Airport_-_127500_-_1b79f1ed8da0a8ef7399ec9ab6b688bc9321a1d0_yes.jpg)


