Note, Index prices reflect the previous 7 days of trading.
Trading Update
Rates from Frankfurt to Shanghai start an initial descent back to normal levels, however they are still held up to $2.15 (down 63 cents or 22.7% from last week).
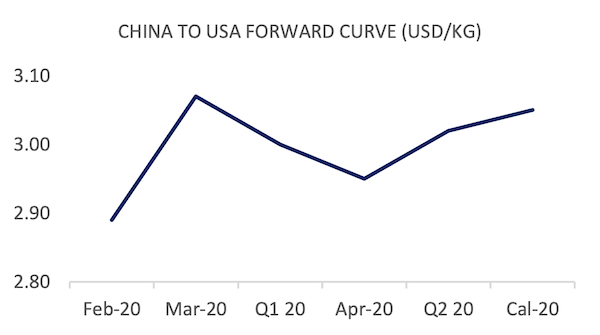
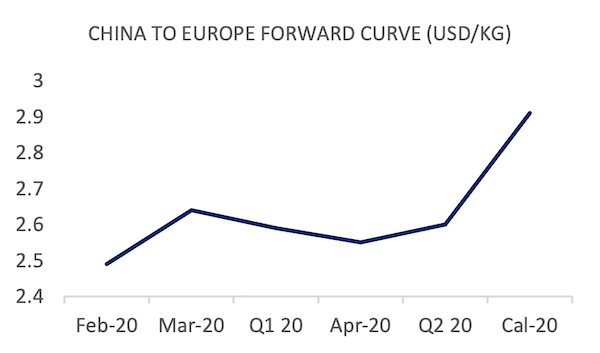
Front month prices retract, down 6 and 11 cents across China to Europe and US respectively. This is in line with open market rates and a delay in export volume. The second month gains 2 cents creating a sharp potential spike in prices from China to US. The second month spike from China to Europe is softened by 1 cent.
Market Comment
From a data perspective, charter traffic into China has already started to spill off, weakening along Frankfurt to Shanghai is indicative of the short and sharp demand for chartered freight into Asia in response to aid requirements. A cursory survey of the news shows us that a large number of freight forwarders and airlines have established charter services into and out of China in preparation for an upcoming spike in freight rates.
Indeed, the fact that 3/4pls have been so keen to trumpet these charter services is foreboding for these rates to be reflected along core trade lanes as they get picked up by the index. This is weighted against a drop in BSA volume and price that will have a few airlines out-of-performance with any spot increase.
Master co-loaders in China will rightly be keen to grasp this as an opportunity to make good on BSA commitments that will have resulted in substantial losses over 2019, however the window may well be very small in order to achieve any form of net benefit over the previous slack market.
Its important to note, the continued flux of rates is not unique to airfreight. Container freight has yet to provide us with any data showing a price increase just yet, with the SCFI comprehensive index down -22.86, and FBX down -7% as of 21st February.
Considering what we know about freight volumes (that they still remain low), both the container index rates and the air freight index rates make rational sense, however provide greater uncertainty as to the scale of any future price swing over the coming weeks.
| Basket | USD/KG | CHANGE | CHANGE % | MTD | VOL % |
| CHINA - EUR | 2.34 | 0.01 | 0.43% | 2.45 | 41.24% |
| CHINA - USA | 2.73 | -0.21 | -7.14% | 2.89 | 24.03% |
| Blended | USD/KG | CHANGE | CHANGE % | MTD | VOL % |
| PVG/EUR | 2.23 | -0.01 | -0.45% | 2.38 | 76.55% |
| HKG/EUR | 2.46 | 0.04 | 1.65% | 2.52 | 26.46% |
| PVG/US | 2.44 | -0.36 | -12.86% | 2.70 | 62.78% |
| HKG/US | 3.03 | -0.05 | -1.62% | 3.09 | 31.42% |
| Global | USD/KG | CHANGE | CHANGE % | MTD | VOL % |
| Air Index | 2.18 | -0.02 | -0.05% | 1.43 | 49.63% |
| Airfreight Route (AR) | Description | USD/KG | CHANGE | CHANGE % | MTD | VOL % |
| AGR 1 | HKG to LAX & ORD & JFK | 2.98 | -0.08 | -0.33% | 2.99 | 35.00% |
| AGR 2 | HKG to LHR & FRA & AMS | 2.56 | -0.02 | -4.12% | 2.74 | 31.00% |
| AGR 3 | HKG to SIN & BKK & PVG | 1.20 | 0.03 | 1.69% | 0.59 | 26.33% |
| AGR 4 | PVG to AMS & FRA & LHR | 2.72 | -0.15 | -5.23% | 2.80 | 74.00% |
Forward Curve - Indicative Update
| FIS AFFA, CHINA - EUROPE | USD/KG | ||||
| BID | ASK | VALUE | CHANGE | |
| Feb-20 | 2.43 | 2.55 | 2.49 | -0.06 |
| Mar-20 | 2.60 | 2.68 | 2.64 | -0.01 |
| Q1 20 | 2.54 | 2.63 | 2.59 | -0.01 |
| Apr-20 | 2.45 | 2.65 | 2.55 | 0.00 |
| Q2 20 | 2.59 | 2.72 | 2.60 | 0.00 |
| Cal-20 | 2.71 | 3.11 | 2.91 | 0.00 |
| FIS AFFA, CHINA - USA | USD/KG | ||||
| BID | ASK | VALUE | CHANGE | |
| Feb-20 | 2.79 | 2.99 | 2.89 | -0.11 |
| Mar-20 | 3.03 | 3.11 | 3.07 | 0.02 |
| Q1 20 | 2.97 | 3.09 | 3.00 | -0.03 |
| Apr-20 | 2.85 | 3.05 | 2.95 | 0.00 |
| Q2 20 | 2.92 | 3.12 | 3.02 | 0.00 |
| Cal-20 | 2.95 | 3.15 | 3.05 | 0.00 |