Trading Update
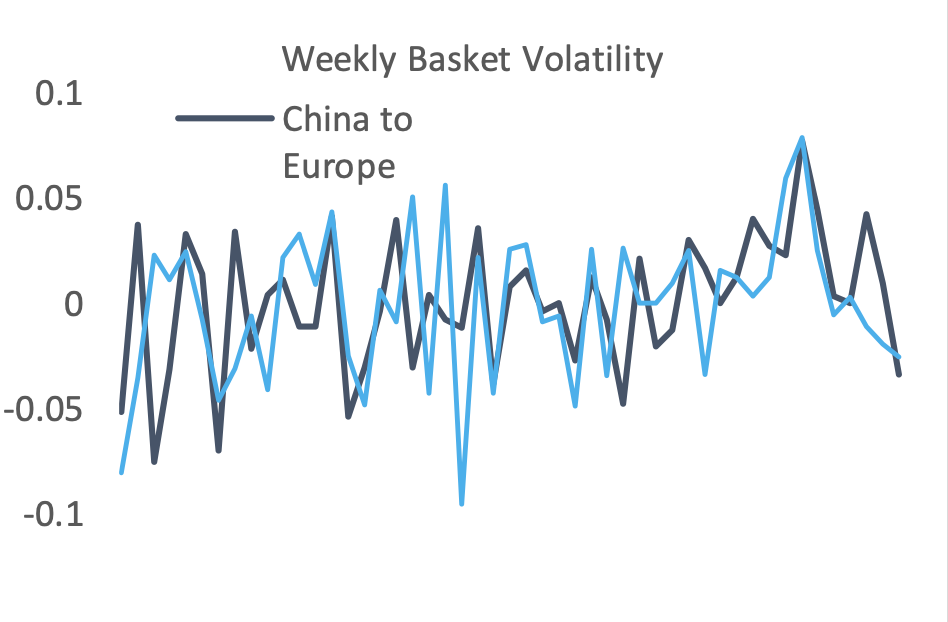
With a sharp entry into 2020, a few lanes so show several severe price losses with China to Europe dropping 5 cents from last week, and Shanghai to Europe dropping a significant 17 cents. Price drops largely expected, China to US has in fact been held up with a gain of 1 cent. Support might be attributable to the movement of goods prior to the early Chinese New Year.
In the forward curves, front month prices drop off 10 and 11 cents respectively in line with Q1 spot trading, which sits at a value of $2.68 and $3.11. Importantly CAL 20 has yet to show the dramatic moves we might expect considering the slack 2019 year, with China to US CAL 20 gaining 5 cents reflecting long term positivism.
Market Comment
A happy new year! - Much like our New Years Resolutions, eternal optimism has been quickly washed away by severe tension between Iran and US, spiking activity in the oil market. Australian bush fires reach critical levels, and as with most years we could be forgiven that the world might be ending.
The same, it seems, cannot be said for the air freight market. A possible boon for airlines (as unusual at this sounds), higher fuel prices might cause a muted 'IMO 2020 container effect' whereby fuel costs are rolled into freight costs. Further, IATA's optimism for the year ahead rings in our ears. The prospective fundamentals are good for a bounce off of the bottom, however given the convergence of several lanes (primarily prices ex. Hong Kong vs Shanghai) we are hesitant to forecast any sort of recovery.
Some things we might look out for in the coming few months -
- Continuing price development ex. Shanghai
- Support or recovery of the Hong Kong airfreight market
- The effect of any trade deal between US and China on direct volume and trans-shipped volume
- The price efficiency and size of the BSA market moving into 2020
In truth, volumes remain highly uncertain, e-commerce was strong in 2019 however this could not successfully drive up airfreight prices until well into the end of the year. The baseline price for ACMIs, BSAs and other long term contracts will be the lowest it has been for 4 years, encouraging volatility and increasing the risk-factor for the market as we move through 2020.
| Basket | USD/KG | CHANGE | CHANGE % | MTD | VOL % |
| CHINA - EUR | 2.76 | -0.05 | -1.78% | 2.76 | 23.19% |
| CHINA - USA | 3.17 | 0.01 | 0.32% | 3.17 | 24.90% |
| Blended | USD/KG | CHANGE | CHANGE % | MTD | VOL % |
| PVG/EUR | 2.59 | -0.17 | -6.16% | 2.59 | 29.99% |
| HKG/EUR | 2.93 | 0.06 | 2.09% | 2.93 | 33.21% |
| PVG/US | 3.17 | 0.17 | 5.67% | 3.17 | 30.08% |
| HKG/US | 3.17 | -0.15 | -4.52% | 3.17 | 35.90% |
| Global | USD/KG | CHANGE | CHANGE % | MTD | VOL % |
| Air Index | 2.39 | 0.00 | 0.00% | 2.40 | 44.29% |

| Lane Pairs | Spread | Ratio |
| CHINA - EUR vs USA | 0.41 | 7.23% |
| HKG vs PVG - EUR | 0.34 | 8.12% |
| HKG vs PVG - USA | 0 |
Forward Curve - Indicative Update
| FIS AFFA, CHINA - EUROPE | USD/KG | ||||
| BID | ASK | VALUE | CHANGE | |
| Jan-20 | 2.70 | 2.78 | 2.74 | -0.10 |
| Feb-20 | 2.63 | 2.75 | 2.69 | -0.07 |
| Mar-20 | 2.53 | 2.69 | 2.61 | 0.00 |
| Q1 20 | 2.58 | 2.78 | 2.68 | 0.00 |
| Q2 20 | 2.58 | 2.70 | 2.59 | 0.00 |
| Cal-20 | 2.75 | 3.15 | 2.95 | -0.10 |

| FIS AFFA, CHINA - USA | USD/KG | ||||
| BID | ASK | VALUE | CHANGE | |
| Jan-20 | 3.12 | 3.20 | 3.16 | -0.11 |
| Feb-20 | 3.18 | 3.26 | 3.22 | 0.00 |
| Mar-20 | 3.16 | 3.24 | 3.20 | 0.00 |
| Q1 20 | 3.21 | 3.35 | 3.19 | 0.00 |
| Q2 20 | 3.20 | 3.30 | 3.25 | 0.00 |
| Cal-20 | 3.20 | 3.40 | 3.30 | 0.05 |

-and-William-Lee-of-SF-Airlines-_-_127500_-_b76515ad8a48b365160a898b41931f2909db40fe_yes.png)


_N434AS_approaching_Newark_Liberty_International_Airport_-_127500_-_1b79f1ed8da0a8ef7399ec9ab6b688bc9321a1d0_yes.jpg)


