Trading Update
Initial Q4 trading interest has drastically adjusted forward price outlook, dropping 21 cents away from the journalistic forward curve. Immediate JUL and AUG changes on both CN to US and EU fall in line with the ongoing spot market.
Market Comment
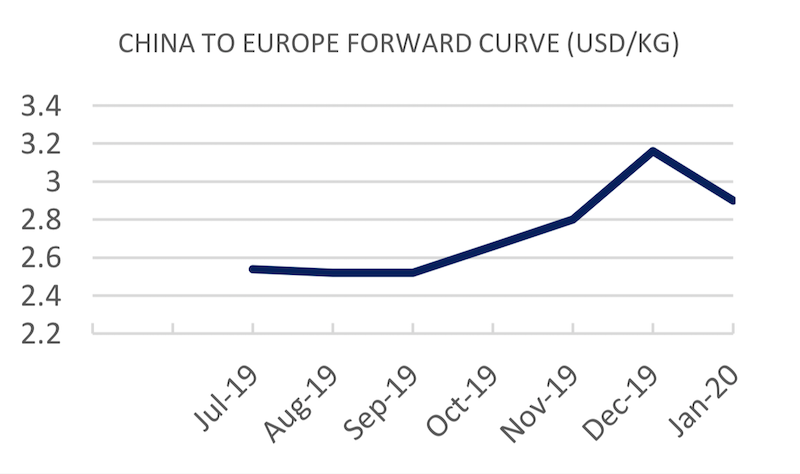
The China to Europe forward curve reflecting a dismal market outlook leading into Q4, reflecting continual softening on the majority of spot market lanes over June and July. The spot market sees a slight increase this week, jumping back out of the whole it dug itself in the previous trading week.
Like confidence in Brexit process, prices into London sink back in line with pessimistic forecasts. Week to week volatility remains unpredictable, with the trans-Atlantic roller coaster hurtling back to earth (London to US drops to 0.88USD/KG, its lowest level since April 2017).
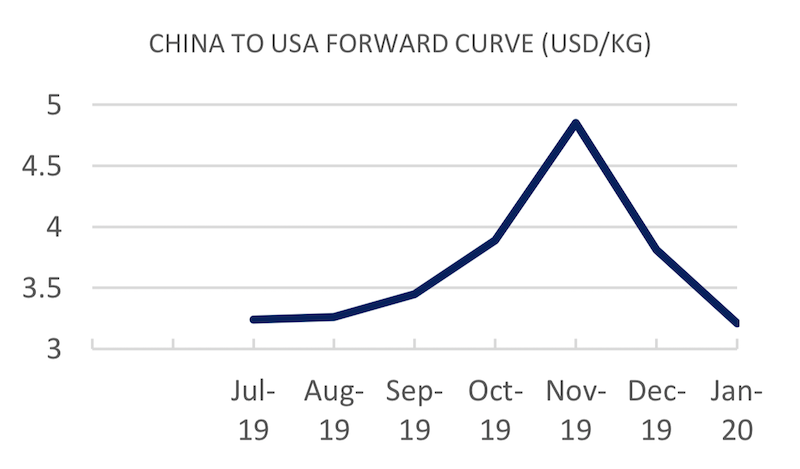
China to US shows a slight bounce into the positive, up 8 cents to 3.19USD/KG, rates continue to drift along the Pacific floor with little outlook of immediate buoyancy.
Although the market is in line with the current bevy of disparaging and depressing remarks from industry pundits and freight market leaders, immediate volatility remains impossible to predict. As always FIS encourages market players to hedge their exposure to provide margin certainty.
| Basket | USD/KG | CHANGE | CHANGE % | MTD |
| CHINA - EUR | 2.52 | 0.03 | 1.20% | 2.54 |
| CHINA - USA | 3.19 | 0.08 | 2.57% | 3.24 |
| Blended | USD/KG | CHANGE | CHANGE % | MTD |
| PVG/EUR | 2.38 | -0.04 | -1.65% | 2.42 |
| HKG/EUR | 2.67 | 0.11 | 4.30% | 2.67 |
| PVG/US | 3.13 | 0.18 | 6.10% | 3.17 |
| HKG/US | 3.26 | -0.01 | -0.31% | 3.30 |
The Freight Investor Services air cargo market report combines data from The Air Cargo (TAC) Index and perspectives from our wide array of clients to provide an view on the historical, present and future air cargo market. Constantly under review, market players can use the report to judge and assess air freight market volatility.The Forward Curve is an amalgamation of previous and prospective market data, weighted by live market information provided by our wide array of corporate clients. When trading an air cargo derivative, you can use the forward curve in conjuction with your own propriortory data to take a view as to where you think the market will turn next.
‘Airfreight routes (AGRs)’ provide us with tradeable routes in conjunction with baskets, by maximising volumes along regional tradelanes. AGRs calculate the average of several correlating arrival points noted by their airport codes.
| Airfreight Route (AR) | Description | PREVIOUS | USD/KG | CHANGE |
| AGR 1 | HKG to LAX & ORD & JFK | 3.21 | 3.18 | -0.93% |
| AGR 2 | HKG to LHR & FRA & AMS | 2.93 | 2.81 | -4.09% |
| AGR 3 | HKG to SIN & BKK & PVG | 1.18 | 1.18 | 0.00% |
| AGR 4 | PVG to AMS & FRA & LHR | 2.30 | 2.35 | 2.17% |
| Forward Curve - Indicative Update | ||||
| CHINA - EUROPE | USD/KG | ||||
| BID | ASK | VALUE | CHANGE | |
| Jul-19 | 2.52 | 2.56 | 2.54 | -0.05 |
| Aug-19 | 2.50 | 2.53 | 2.52 | -0.02 |
| Sep-19 | 2.45 | 2.60 | 2.52 | 0.00 |
| Q4 19 | 2.85 | 2.89 | 2.87 | -0.21 |
| Cal - 19 | 3.04 | 3.14 | 3.09 | 0.00 |
| Cal - 20 | 3.44 | 3.54 | 3.49 | 0.00 |
| Forward Curve - Indicative Update | ||||
| CHINA - USA | USD/KG | ||||
| BID | ASK | VALUE | CHANGE | |
| Jul-19 | 3.20 | 3.26 | 3.24 | -0.06 |
| Aug-19 | 3.23 | 3.30 | 3.26 | -0.05 |
| Sep-19 | 3.29 | 3.60 | 3.45 | 0.00 |
| Q4 19 | 4.13 | 4.23 | 4.18 | 0.00 |
| Cal - 19 | 3.91 | 4.01 | 3.96 | 0.00 |
| Cal - 20 | 4.12 | 4.22 | 4.17 | 0.00 |