Trading Update
Prices surge across all core APAC routes, China to Europe up 39 cents ($3.03/kg / +14.77%), China to USA explodes up 72 cents ($4.21 / +20.63%). China to USA is lifted up by an exceptional $1.08/kg price increase (up 29.75% to $4.71) as volumes resume to normal levels.
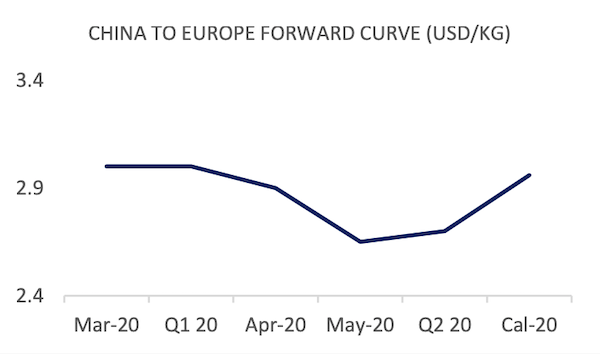
The entire visible forward curve is lifted on the explosion of freight rates, drawing up front month prices. China to Europe Mar 20 up 35 cents, China to USA prices up 49 cents. April and May 2020 prices trail with price increases, AFFA values into Europe up 28 cents, into USA up 12 cents.
Market Comment
2020 is fast becoming year of the freighter, what was a highly market susceptible asset for airfreight in 2019, has now become a profit generator for a number of freighter-only airlines that were highly nervous as to the outlook for the airfreight market, as recently as January this year. The dramatic shift in price generated by a severe lack of belly freight capacity, lifting pent up cargo-throughput that was previously bottle-necked in Asia, will be a welcome reprieve from the pain freighter operators endured in 2019.
All the while, mixed fleet and belly-freight only operators will be enduring the pain of having enormous sections of their networks shut down. The focus has been on Trans-Atlantic passenger traffic, the result is a reduction of freight capacity by as much as 75%. The spill over has been inevitable, Norwegian Air temporarily lays off 7,300 staff and cuts 85% of flights, SAS lays of 90% of its workforce, Virgin Atlantic enforces 8 weeks of unpaid leave. Many of these carriers will have to work out the cost/revenue calculations of running passenger aircraft purely for the purposes of providing air cargo uplift.
Even with events such as the 2015 US West Coast port strikes in recent memory, COVID-19 has now become an exceptionally disruptive event for supply chains globally. Upstream problems have now become downstream problems, as imports from Asia will now hit slack consumer demand in Europe and North America.
The impact of this completely unpredictable, out-of-cycle event has pushed price risk management, and risk management of all kinds into the limelight. Although freighter operators stand to clean-up on current market conditions, the risks of these assets still exist. In our view hedging should rightly be seen as a necessity, not a nicety, in the market that consistently surprises and disrupts.
| Basket | USD/KG | CHANGE | CHANGE % | MTD | VOL % |
| CHINA - EUR | 3.03 | 0.39 | 14.77% | 2.69 | 54.59% |
| CHINA - USA | 4.21 | 0.72 | 20.63% | 3.59 | 63.47% |
| Blended | USD/KG | CHANGE | CHANGE % | MTD | VOL % |
| PVG/EUR | 3.19 | 0.48 | 17.71% | 2.74 | 85.18% |
| HKG/EUR | 2.86 | 0.28 | 10.85% | 2.65 | 36.21% |
| PVG/US | 4.71 | 1.08 | 29.75% | 3.75 | 105.66% |
| HKG/US | 3.70 | 0.35 | 10.45% | 3.42 | 38.87% |
| Global | USD/KG | CHANGE | CHANGE % | MTD | VOL % |
| Air Index | 2.60 | 0.29 | 11.75% | 2.27 | 49.63% |

| Airfreight Route (AR) | Description | USD/KG | CHANGE | CHANGE % | MTD | VOL % |
| AGR 1 | HKG to LAX & ORD & JFK | 3.86 | 0.38 | 10.91% | 3.44 | 35.00% |
| AGR 2 | HKG to LHR & FRA & AMS | 2.92 | 0.31 | 11.97% | 2.66 | 31.00% |
| AGR 3 | HKG to SIN & BKK & PVG | 1.72 | 0.23 | 22.13% | 1.48 | 26.33% |
| AGR 4 | PVG to AMS & FRA & LHR | 3.14 | 0.40 | 14.59% | 2.76 | 74.00% |
Forward Curve - Indicative Update
| FIS AFFA, CHINA - EUROPE | USD/KG | ||||
| BID | ASK | VALUE | CHANGE | |
| Mar-20 | 2.75 | 3.25 | 3.00 | 0.35 |
| Q1 20 | 2.75 | 3.25 | 3.00 | 0.35 |
| Apr-20 | 2.65 | 3.15 | 2.90 | 0.28 |
| May-20 | 2.59 | 2.71 | 2.65 | 0.10 |
| Q2 20 | 2.60 | 2.80 | 2.70 | 0.10 |
| Cal-20 | 2.76 | 3.16 | 2.96 | 0.05 |
| FIS AFFA, CHINA - USA | USD/KG | ||||
| BID | ASK | VALUE | CHANGE | |
| Mar-20 | 3.75 | 4.15 | 3.95 | 0.49 |
| Q1 20 | 3.75 | 4.15 | 3.95 | 0.49 |
| Apr-20 | 3.05 | 3.35 | 3.20 | 0.12 |
| May-20 | 3.05 | 3.25 | 3.15 | 0.05 |
| Q2 20 | 3.00 | 3.20 | 3.10 | 0.08 |
| Cal-20 | 3.00 | 3.30 | 3.15 | 0.10 |


