Market Comment
Reacting in line with the tariff-driven boost to Asia-US prices last week, prices this week into the US have retracted to base levels reflecting a settling of the market. Interestingly there is a convergence between annual contract rates and the spot market, diminishing the benefit of fixed annual BSAs.
As such the forward curves leading into the end of the year has been revised down to meet current forward demand. Week on week volatility remains significant, and long term projections are uncertain. The effect of rising fuel prices on carrier operating cost has yet to be seen over the past 3 years, however given slack freight demand this may lead to a greater impact.
The Freight Investor Services air cargo market report combines data from The Air Cargo (TAC) Index and perspectives from our wide array of clients to provide an view on the historical, present and future air cargo market. Constantly under review, market players can use the report to judge and assess air freight market volatility.The Forward Curveis an amalgamation of previous and prospective market data, weighted by live market information provided by our wide array of corporate clients. When trading an air cargo derivative, you can use the forward curve in conjuction with your own propriortory data to take a view as to where you think the market will turn next.
| Basket | USD/KG | CHANGE | CHANGE % | MTD |
| CHINA - EUR | 2.57 | 0.01 | 0.39% | 2.59 |
| CHINA - USA | 3.37 | -0.15 | -4.26% | 3.41 |
| Blended | USD/KG | CHANGE | CHANGE % | MTD |
| PVG/EUR | 2.54 | 0.07 | 2.83% | 2.51 |
| HKG/EUR | 2.60 | -0.05 | -1.89% | 2.67 |
| PVG/US | 3.18 | -0.03 | -0.93% | 3.22 |
| HKG/US | 3.56 | -0.27 | -7.05% | 3.60 |
‘Airfreight routes (AGRs)’provide us with tradeable routes in conjunction with baskets, by maximising volumes along regional tradelanes. AGRs calculate the average of several correlating arrival points noted by their airport codes
| Airfreight Route (AR) | Description | PREVIOUS | USD/KG | CHANGE |
| AGR 1 | HKG to LAX & ORD & JFK | 3.3 | 3.48 | 5.45% |
| AGR 2 | HKG to LHR & FRA & AMS | 2.62 | 2.71 | 3.43% |
| AGR 3 | HKG to SIN & BKK & PVG | 1.16 | 1.12 | -3.35% |
| AGR 4 | PVG to AMS & FRA & LHR | 2.59 | 2.65 | 2.32% |
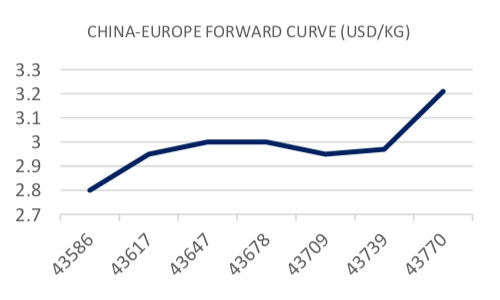
Forward Curve - Indicative Update
| HKG/CN - EUROPE AGGREGATE LANES - USD/KG | ||||
| BID | ASK | VALUE | CHANGE | |
| May | 2.75 | 2.85 | 2.80 | -0.10 |
| Jun | 2.90 | 3.00 | 2.95 | 0.00 |
| Jul | 2.95 | 3.05 | 3.00 | 0.00 |
| Q3 19 | 2.90 | 3.00 | 2.95 | 0.00 |
| Cal - 19 | 3.04 | 3.14 | 3.09 | 0.00 |
| Cal - 20 | 3.44 | 3.54 | 3.49 | 0.00 |
| HKG/CN - US AGGREGATE LANES - USD/KG | ||||
| BID | ASK | VALUE | CHANGE | |
| May | 3.40 | 3.50 | 3.45 | -0.09 |
| Jun | 3.33 | 3.43 | 3.38 | 0.00 |
| Jul | 3.35 | 3.45 | 3.40 | 0.00 |
| Q3 19 | 3.68 | 3.78 | 3.73 | 0.00 |
| Cal - 19 | 3.91 | 4.01 | 3.96 | 0.00 |
| Cal - 20 | 4.12 | 4.22 | 4.17 | 0.00 |


