Market Comment
Spot markets continue to act erratically, largely positive price moves have been weighted down by a weakening of rates into Frankfurt. Carriers are looking to redress the supply/demand balance by limiting schedules and parking aircraft over the summer season.
Rates are still supported above 2016 levels, with the market spurring the inclusion of Index Linked Agreements within the contract portfolio of several airlines - largely aimed to launch at the start of 2020.
| Basket | USD/KG | CHANGE | CHANGE % | MTD |
| CHINA - EUR | 2.55 | -0.02 | -0.78% | 2.58 |
| CHINA - USA | 3.56 | 0.19 | 5.64% | 3.45 |
| Blended | USD/KG | CHANGE | CHANGE % | MTD |
| PVG/EUR | 2.49 | -0.05 | -1.97% | 2.51 |
| HKG/EUR | 2.60 | 0.00 | 0.00% | 2.65 |
| PVG/US | 3.25 | 0.07 | 2.20% | 3.23 |
| HKG/US | 3.86 | 0.30 | 8.43% | 3.66 |
The Freight Investor Services air cargo market report combines data from The Air Cargo (TAC) Index and perspectives from our wide array of clients to provide an view on the historical, present and future air cargo market. Constantly under review, market players can use the report to judge and assess air freight market volatility.The Forward Curve is an amalgamation of previous and prospective market data, weighted by live market information provided by our wide array of corporate clients. When trading an air cargo derivative, you can use the forward curve in conjuction with your own propriortory data to take a view as to where you think the market will turn next.
Airfreight routes
‘Airfreight routes (AGRs)’ provide us with tradeable routes in conjunction with baskets, by maximising volumes along regional tradelanes. AGRs calculate the average of several correlating arrival points noted by their airport codes
| Airfreight Route (AR) | Description | PREVIOUS | USD/KG | CHANGE |
| AGR 1 | HKG to LAX & ORD & JFK | 3.48 | 3.62 | 4.02% |
| AGR 2 | HKG to LHR & FRA & AMS | 2.71 | 2.65 | -2.21% |
| AGR 3 | HKG to SIN & BKK & PVG | 1.12 | 1.17 | 4.46% |
| AGR 4 | PVG to AMS & FRA & LHR | 2.65 | 2.57 | -3.01% |
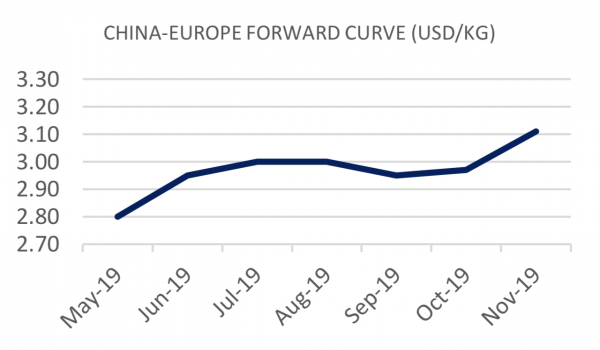
Forward Curve - Indicative Update
| HKG/CN - EUROPE AGGREGATE LANES - USD/KG | ||||
| BID | ASK | VALUE | CHANGE | |
| May | 2.75 | 2.85 | 2.80 | 0.00 |
| Jun | 2.90 | 3.00 | 2.95 | 0.00 |
| Jul | 2.95 | 3.05 | 3.00 | 0.00 |
| Q3 19 | 2.90 | 3.00 | 2.95 | 0.00 |
| Cal - 19 | 3.04 | 3.14 | 3.09 | 0.00 |
| Cal - 20 | 3.44 | 3.54 | 3.49 | 0.00 |
| HKG/CN - US AGGREGATE LANES - USD/KG | ||||
| BID | ASK | VALUE | CHANGE | |
| May | 3.40 | 3.50 | 3.45 | 0.00 |
| Jun | 3.33 | 3.43 | 3.38 | 0.00 |
| Jul | 3.35 | 3.45 | 3.40 | 0.00 |
| Q3 19 | 3.68 | 3.78 | 3.73 | 0.00 |
| Cal - 19 | 3.91 | 4.01 | 3.96 | 0.00 |
| Cal - 20 | 4.12 | 4.22 | 4.17 | 0.00 |


