Trading Update
Divergence continues between China to Europe and China to US, spreading a further 16 cents, however the biggest news is the continued growth in rates ex-Asia into Europe. Driven by a further recovery of Hong Kong rates (up 13 cents in line with Shanghai), however Shanghai to Europe continues to climb.
Market Comment
Caught short on last weeks information, the general consensus that Q4 2019 is a damp squib holds true for at least one major trade route - the impact of the trade war that has restrained trans-pacific air freight and shipping is poignantly demonstrated by the pre-mature decline of Asia-US prices. Any hope of trans-Pacific price recovery in 2019 has well and truly dissolved.
However, it appears trade into Europe from China has found another gear, possibly linked to a combination of an open trade window, abundance of competing freight carriers, the urgency and chaos provided by Brexit, and inventory stocking thanks to good old fashioned European Christmas consumerism.
All the while, although volumes are still relatively low (we can still only count on rumour and hearsay for volume figures) dulling the benefit carriers will reap from high prices, Shanghai continues to build its presence over and above its role in the 2017-2018 boom markets. Those heavily invested in the growth of South-East Asia have been put on high alert given the very vague premise of a downgrade in the trade war, and the very real downgrade of the Malaysian CAA (CAAM) by the US FAA. This threatens to critically damage forwarders, shippers and airlines keen to expand their control over the region in what risks becoming a physical market bubble.
Our aim, as always, is to help the air freight industry manage a recurring list of physical price risks that have bled millions from the market in 2019. This includes the hedging of Asia air freight prices which often appear to have a mind of their own.
| Basket | USD/KG | CHANGE | CHANGE % | MTD |
| CHINA - EUR | 3.20 | 0.13 | 4.23% | 3.10 |
| CHINA - USA | 3.60 | -0.04 | -1.10% | 3.63 |
| Blended | USD/KG | CHANGE | CHANGE % | MTD |
| PVG/EUR | 3.06 | 0.13 | 4.44% | 2.94 |
| HKG/EUR | 3.34 | 0.13 | 4.05% | 3.26 |
| PVG/US | 3.49 | -0.06 | -1.69% | 3.51 |
| HKG/US | 3.72 | -0.02 | -0.53% | 3.75 |
| Airfreight Route (AR) | Description | PREVIOUS | USD/KG | CHANGE |
| AGR 1 | HKG to LAX & ORD & JFK | 3.92 | 3.82 | -2.55% |
| AGR 2 | HKG to LHR & FRA & AMS | 3.24 | 3.31 | 2.16% |
| AGR 3 | HKG to SIN & BKK & PVG | 1.16 | 1.16 | 0.00% |
| AGR 4 | PVG to AMS & FRA & LHR | 2.94 | 3.14 | 6.80% |
Forward Curve - Indicative Update
| HKG/CN - EUROPE AGGREGATE LANES - USD/KG | ||||
| BID | ASK | VALUE | CHANGE | |
| Nov-19 | 3.07 | 3.11 | 3.09 | 0.02 |
| Dec-19 | 2.89 | 2.98 | 2.94 | 0.01 |
| Jan-20 | 2.77 | 2.89 | 2.83 | 0.00 |
| Q4 19 | 3.01 | 3.11 | 3.06 | 0.01 |
| Cal-19 | 3.00 | 3.10 | 3.05 | 0.00 |
| Cal-20 | 3.07 | 3.17 | 3.12 | 0.00 |

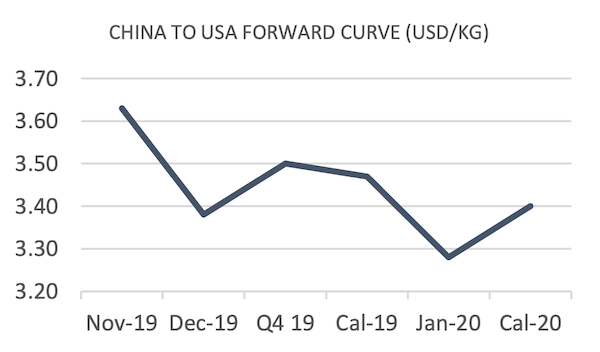
| HKG/CN - US AGGREGATE LANES - USD/KG | ||||
| BID | ASK | VALUE | CHANGE | |
| Nov-19 | 3.57 | 3.69 | 3.63 | -0.01 |
| Dec-19 | 3.33 | 3.42 | 3.38 | 0.00 |
| Jan-20 | 3.21 | 3.35 | 3.28 | -0.10 |
| Q4 19 | 3.46 | 3.54 | 3.50 | 0.00 |
| Cal-19 | 3.42 | 3.52 | 3.47 | 0.00 |
| Cal-20 | 3.30 | 3.50 | 3.40 | -0.20 |