Trading Update
China to USA finally sees marginal gains of 6 cents this week however the general Asia-US trade lane continues to flat-line with rates down 30% since the same time last year.
Interestingly prices out of Shanghai are roughly comparable from the index levels of 2018, (pricing at $2.69 in 2018, now sitting at $2.64 in 2019).
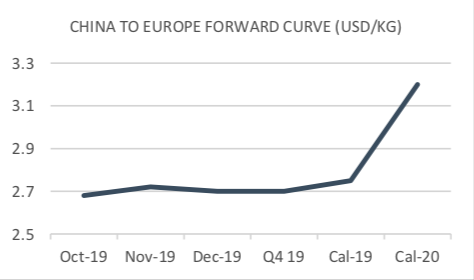
Positive growth into Europe is demonstrated by a climbing forward curve, however peak season projections remain fairly flat. China to USA holds its low front month value of $3.37, however CAL 20 loses 20 and 19 cents respectively as the prospective market starts to price in.
Market Comment
Positive pricing (finally) floods in as Q4 prices into Europe build pace. However, and as is usual in almost every one of our reports thus far, trade wars continue to affect seasonal price movements from China to North America.
Although you could take a 1.82% gain as sign of an impending and severely delayed entry into peak season, rates continue to be severely depressed even with a significant shift of volumes into mainland Chinese airports. All the while retractions of trade tariffs have had little immediate market-wide effect, making week on week and month on month pricing consistently hard to predict.
All the while a smattering of European and British politicians declare 'mission accomplished' with a Brexit deal, however a warmed over version of an older 'deal' seems to allay little in terms of volatility within freight markets. Delay continues as votes extend closer to the Brexit deadline on 31st October.
South East Asia continues to grow in terms of volume, whilst other niche markets across Asia and Africa make marginal volume gains.
Far from an anti-climax, the uncertain reaction of freight prices across air and box markets have moved start-of-the-year projections well out of correlation with actual freight rates. Container rates bottom out despite efforts by carriers to align capacity with demand (FBX 01 at $1,318, SCFI USWC at $1,368, whilst air freight capacity continues to fly without the revenue generating cargo that supported the market in 2017 and 2018.
| Basket | USD/KG | CHANGE | CHANGE % | MTD |
| CHINA - EUR | 2.72 | 0.06 | 2.26% | 2.66 |
| CHINA - USA | 3.36 | 0.06 | 1.82% | 3.31 |
| Blended | USD/KG | CHANGE | CHANGE % | MTD |
| PVG/EUR | 2.64 | 0.07 | 2.72% | 2.57 |
| HKG/EUR | 2.81 | 0.06 | 2.18% | 2.75 |
| PVG/US | 3.37 | 0.17 | 5.31% | 3.26 |
| HKG/US | 3.35 | -0.05 | -1.47% | 3.35 |
| Airfreight Route (AR) | Description | PREVIOUS | USD/KG | CHANGE |
| AGR 1 | HKG to LAX & ORD & JFK | 3.39 | 3.45 | 1.77% |
| AGR 2 | HKG to LHR & FRA & AMS | 2.68 | 2.8 | 4.48% |
| AGR 3 | HKG to SIN & BKK & PVG | 1.11 | 1.12 | 0.90% |
| AGR 4 | PVG to AMS & FRA & LHR | 2.58 | 2.66 | 3.10% |
Forward Curve - Indicative Update
| CHINA - EUROPE | USD/KG | ||||
| BID | ASK | VALUE | CHANGE | |
| Oct-19 | 2.64 | 2.72 | 2.68 | 0.08 |
| Nov-19 | 2.68 | 2.76 | 2.72 | 0.02 |
| Dec-19 | 2.67 | 2.75 | 2.70 | -0.01 |
| Q4 19 | 2.66 | 2.74 | 2.70 | 0.02 |
| Cal - 19 | 2.70 | 2.80 | 2.75 | 0.00 |
| Cal - 20 | 3.15 | 3.25 | 3.20 | -0.20 |
| CHINA - USA | USD/KG | ||||
| BID | ASK | VALUE | CHANGE | |
| Oct-19 | 3.35 | 3.39 | 3.37 | 0.02 |
| Nov-19 | 3.50 | 3.60 | 3.51 | 0.00 |
| Dec-19 | 3.25 | 3.45 | 3.35 | 0.00 |
| Q4 19 | 3.38 | 3.45 | 3.41 | -0.03 |
| Cal - 19 | 3.35 | 3.45 | 3.40 | 0.00 |
| Cal - 20 | 3.71 | 3.91 | 3.81 | -0.19 |


