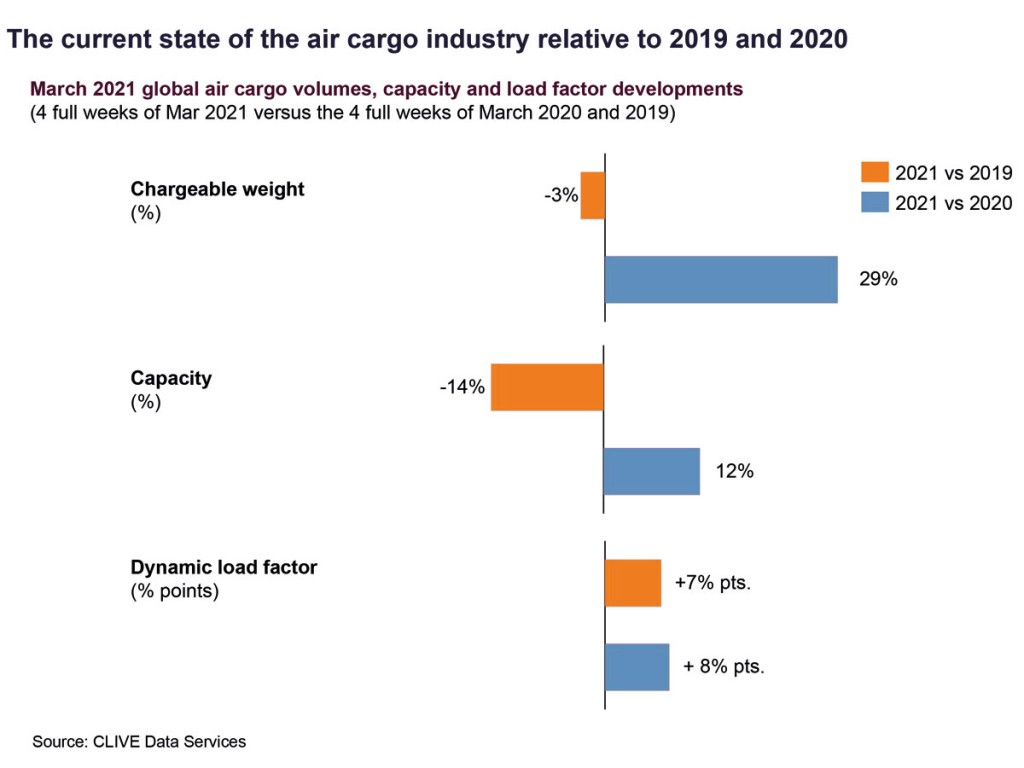
The New Year recovery in global air cargo volumes stalled in March as volumes fell -3% versus comparative data for March 2019, but reduced airline capacity levels saw the ‘dynamic loadfactor’ and prices remain ‘relentlessly high,’ according to the latest market data from industry analysts CLIVE Data Services and TAC Index.
To give a meaningful perspective of the air cargo industry’s performance, CLIVE Data Services’ first-to-market data is continuing to focus on comparing the current state of the market to pre-Covid 2019 volume, capacity and load factor data until at least Q3 of this year. This is being produced alongside the 2020 comparison.

However, with airline cargo capacity down -14% versus 2019, CLIVE Data Services’ dynamic loadfactor – which considers volume and weight perspectives of cargo flown and capacity available - remained relentlessly high: 73% for the period, 7% points higher than in 2019. This decline in capacity relative to 2019 should be seen, however, in the context of passenger airlines starting their busier traditional summer schedules in March 2019 - which is obviously not the case this time around.
Niall van de Wouw, Managing Director of CLIVE Data Services, commented: “March data shows us the market is still very supply driven. After indicators that the global air cargo market was seeing some ‘light at the end of the tunnel’ in January and February after a year of such high disruption, this latest industry data will reign in that optimism slightly. This may reflect Covid-19 fatigue in the buying habits of businesses and consumers as we see more reports of infection rates creeping up again in many countries, fears of a possible third wave of the virus, more lockdowns and curfews, and concerns over both the supply and effectiveness of vaccines. Flights are very full from a cargo point of view, but with no recovery in the passenger market, airline intercontinental operations are still mainly cargo-driven and they need higher prices to make these operations financially viable.”
On the Atlantic, CLIVE reports record load factors in both directions, reaching 90% westbound for the last two weeks of March. On eastbound sectors, for example, the Chicago (ORD) to Western Europe route reached levels of 80% earlier in the month, the tipping point at which prices often increase exponentially. On this market, they went up by around 25% during this timeframe, even though the loadfactor increased by ‘just’ 5% points. ‘And the prices came down just as fast again when the loadfactor dropped below this tipping point,’ CLIVE stated.
Comparing the current China-to-Europe tradelane to 2019 shows a similar pattern at a global level. The push forward in this market seems to be decelerating. Volumes in the second week of March were 7% higher than in 2019, but then dropped to 6% and 4% in the following weeks. But data shows westbound flights from China still filled to the brim with a ‘dynamic loadfactor’ for the month of 93%.
Analyses by TAC Index continues to confirm the impact of high load factors on airfreight pricing. China and Hong Kong-Europe pricing for the last three years reveals an increase of 30% and 17% respectively year-on-year, or a rise of over 50% versus 2019.
- March 2019 - USD 2.70/kg
- March 2020 - USD 3.51/kg
- March 2021 - USD 4.09/kg
A comparison of London Heathrow (LHR)-North America airfreight prices for March over February shows an increase of GPB 0.28/kg or 8% in average pricing. Comparing March 2020 over March 2021, the average price rose by EUR 2.13/kg. The highest price in March 2021 of GPB 4.04 (week 4/2021) represented an increase of nearly 45%. TAC Index says the increase comparing the first weeks of March 2021 to the same period of March 2019 shows an even more dramatic pricing increase of close to 400%, climbing from GBP 0.93 in 2019 to GBP 3.7 in this latest reporting period.
“Pricing in March and February did not show big volatility month-over-month and, also, the intra-month volatility was not as big as in previous periods. Whether this can now be viewed as a relatively stable situation on a much higher level than in 2019 remains to be seen. It is definitely interesting to note that pricing on all lanes discussed here are higher than at the end of March 2020 when the PPE impact kicked in,” stated Robert Frei, Business Development Director at TAC Index.


