The Freight Transportation Services Index (TSI), which is based on the amount of freight carried by the for-hire transportation industry, fell 0.4% from May to June, the first decrease after 3 consecutive months of growth according to the U.S. Department of Transportation’s Bureau of Transportation Statistics (BTS). From June 2020 to June 2021, the index rose 5.9%; that compares to a decline of 7.0% from June 2019 to June 2020 and a decline of 1.4% from June 2018 to June 2019.
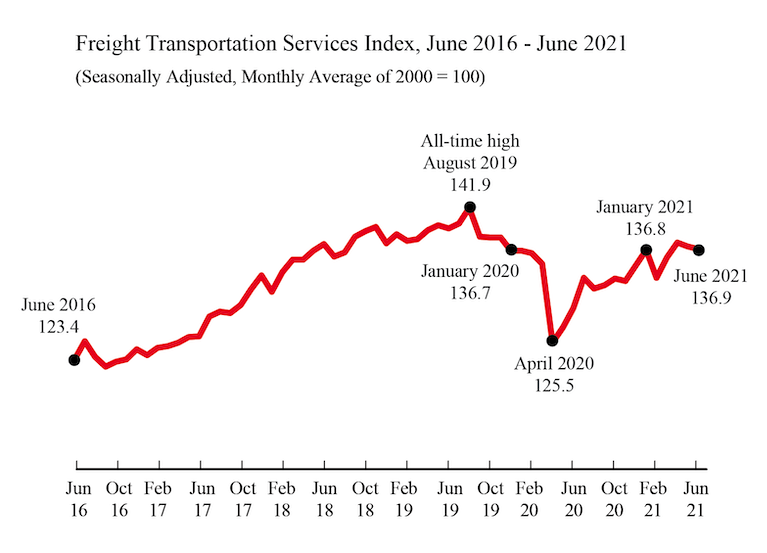
The level of for-hire freight shipments in June measured by the Freight TSI (137.3) was 3.2% below the all-time high level of 141.9 in August 2019 (Table 2A). BTS’ TSI records begin in 2000. See historical TSI data.
The May index was revised to 137.8 from 137.7 in last month’s release. Monthly numbers for March and April were revised up slightly. January was revised down slightly.
BTS is withholding the scheduled release of the passenger and combined indexes for June. The passenger index for June is a statistical estimate of airline passenger travel and other components based on historical trends up to May 2021. The statistical estimate does not fully account for the rapidly changing impacts of the coronavirus on the historical trend. Air freight for May and June are also statistical estimates. Since air freight makes up a smaller part of the freight index, the freight TSI is being released as scheduled with the air freight estimate included.
The Freight TSI measures the month-to-month changes in for-hire freight shipments by mode of transportation in tons and ton-miles, which are combined into one index. The index measures the output of the for-hire freight transportation industry and consists of data from for-hire trucking, rail, inland waterways, pipelines and air freight. The TSI is seasonally-adjusted to remove regular seasons from month-to-month comparisons.
Analysis: The Freight TSI decreased 0.4% in June from May due to seasonally-adjusted decreases in rail carloads, rail intermodal, and trucking despite growth in water, air freight and pipeline. The June decrease took place against a background of growth for other indicators from May to June.
The Federal Reserve Board Industrial Production (IP) Index grew 0.4% in May reflecting increases of 1.4% in mining and 2.7% in utilities while manufacturing shrank by 0.1%. Housing starts were up 6.3%. Personal Income increased by 0.1%. The Institute for Supply Management Manufacturing (ISM) index was down 0.6 points to 60.6, indicating continued but slowing growth in manufacturing.
Although the June Passenger TSI is being withheld because of the previously cited difficulty of estimating airline passenger travel and other components, the May index is now being released. The index decreased 3.7% from April to May following an increase of 12.6% in April. Air passenger declined while rail passenger and transit grew. The Passenger TSI remains above the levels of April 2020 through March 2021 though it has not returned to its level in March 2020, the last month before the impact of the pandemic. It remained below any level the Passenger TSI had been before the pandemic for the 15th consecutive month.
Trend: The June freight index decrease followed three consecutive increases for an increase of 2.9% since February. This was the third decrease in eight months. The Freight TSI is above any level it attained during the COVID pandemic prior to April 2021 but is still below its level of November 2019. The index is 3.2% below its record level of 141.9 in August 2019 and has decreased in ten of the last 22 months since that peak.
The first-quarter TSI increase of 1.0% came in the context of continued quarterly GDP growth.

_-_28de80_-_9b2f972cdce64d5f7c8d952d74a16521db70a589_yes.jpg)