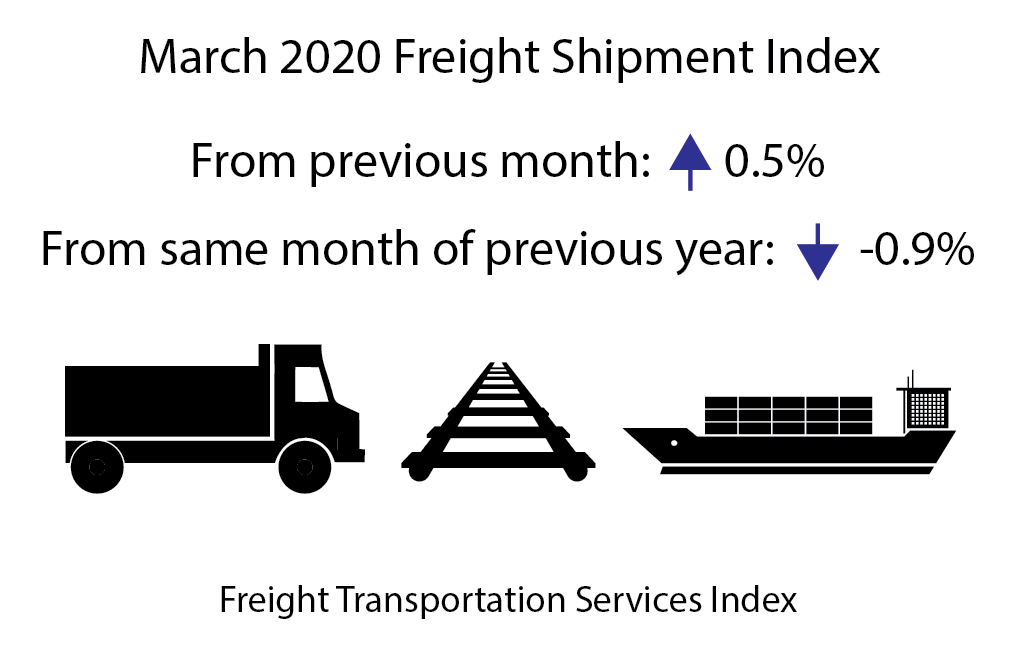
The Freight Transportation Services Index (TSI), which is based on the amount of freight carried by the for-hire transportation industry, rose 0.5% in March from February, rising after a one-month decline, according to the U.S. Department of Transportation’s Bureau of Transportation Statistics’ (BTS). From March 2019 to March 2020, the index fell 0.9% compared to a rise of 1.8% from March 2018 to March 2019 and a rise of 8.4% from March 2017 to March 2018 (Tables 1, 2, and 2A).
The February index was revised to 136.1 from 137.2 in last month’s release.
BTS is withholding the scheduled release of the passenger and combined indexes for March. The passenger index is a statistical estimate of airline passenger travel and other components based on historical trends up to February 2019. As a result, the estimates have yet to fully account for the impact of the coronavirus. Air freight is also a statistical estimate. Since air freight makes up a smaller part of the freight index, the freight TSI is being released as scheduled. The February passenger and combined indexes are available on the BTS website.
The Freight TSI measures the month-to-month changes in for-hire freight shipments by mode of transportation in tons and ton-miles, which are combined into one index. The index measures the output of the for-hire freight transportation industry and consists of data from for-hire trucking, rail, inland waterways, pipelines and air freight. The TSI is seasonally-adjusted to remove regular seasons from month-to-month comparisons.
Analysis: The Freight TSI increased in March from February due to growth in air freight, trucking and water, despite declines in rail carload, rail intermodal and pipeline. The TSI rise was likely due to growth in shipping in the first part of the month. The increase for the month took place against a background of decline in other indicators driven largely by the impact of the COVID-19 virus in the latter part of the month.
Personal Income decreased by 2.0% while housing starts decreased by 22.3%. The Institute for Supply Management Manufacturing (ISM) index was down by 1.0 point to 49.1, indicating a shift from slow growth to contraction in the manufacturing sector. The Federal Reserve Board Industrial Production (IP) Index decreased 5.4% in March reflecting a decrease of 6.3% in manufacturing and smaller decreases in mining and utilities. The decreases for total industrial production and for manufacturing were both the largest since 1946. The ISM manufacturing index is based on a survey of 800 supply chain executives on production, orders, deliveries, and employment, while the Federal Reserve IP index is based on estimated physical output using a range of output measures that the Federal Reserve considers reliable. Comparisons between patterns in the ISM manufacturing and the Federal Reserve IP index should be done with caution.
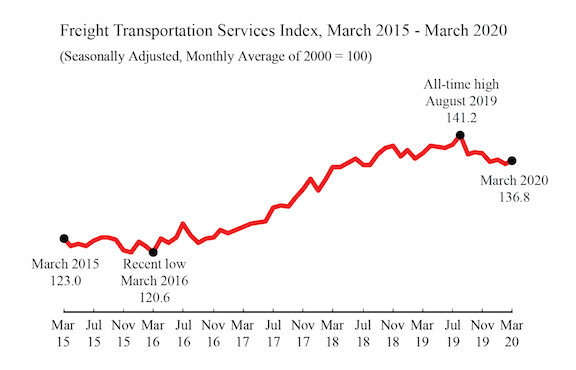
Trend: The 0.5% March increase in the Freight Index was a return to growth after a decrease in February. March was the fourth month in a row that Freight TSI remained in a relatively narrow range, below the levels it had held from September 2018 to November 2019. However, the index remained above any level before June 2018. Despite peaks and dips in the 21 months after June 2018, the March 2020 index was at almost the same level as at the start of that period. For additional historical data, go to TSI data.
Index highs and lows: For-hire freight shipments in March 2020 (136.8) were 44.2% higher than the low in April 2009 during the recession (94.9). The March 2020 level was 3.1% below the historic peak reached in August 2019 (141.2).
Year-to-date: For-hire freight shipments measured by the index were up 0.2% in March compared to the end of 2019 (Table 3).
Long-term trend: For-hire freight shipments are up 11.2% in the five years from March 2015 and are up 29.7% in the 10 years from March 2010 (Table 5).
Same month of previous year: March 2020 for-hire freight shipments were down 0.9% from March 2019 (Tables 4, 5).
1st quarter changes: The freight TSI rose 0.2% in the 1st quarter (Table 10). It was the first quarterly increase following two consecutive declines in the third and fourth quarters of 2019.
The TSI has three seasonally-adjusted indexes that measure changes from the monthly average of the base year of 2000. The three indexes are freight shipments, passenger travel and a combined measure that merges the freight and passenger indexes. See Seasonally-Adjusted Transportation Data for numbers for individual modes. TSI includes data from 2000 to the present. Release of the April index is scheduled for June 10.
Revisions: Monthly data has changed from previous releases due to the use of concurrent seasonal analysis, which results in seasonal analysis factors changing as each month’s data are added.
BTS research has shown a clear relationship between economic cycles and the Freight and Passenger Transportation Services Indexes. See a study of this relationship using smoothed and detrended TSI data. Researchers who wish to compare TSI over time with other economic indicators, can use the FRED database, which includes freight, passenger and combined TSI, and which makes it possible to easily graph TSI alongside the other series in that database. See TSI data on FRED.


