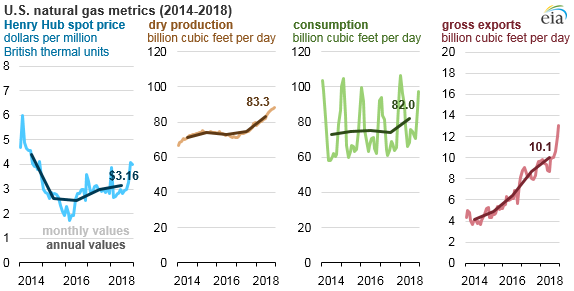
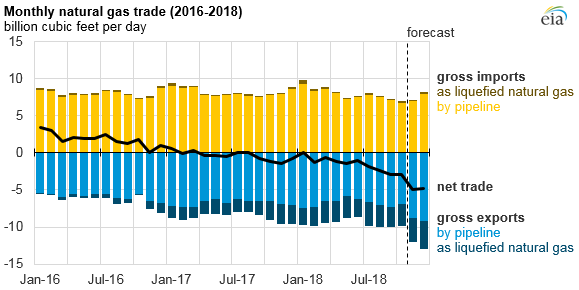
In 2018, the average annual Henry Hub natural gas spot price increased to $3.16 per million British thermal units (MMBtu), up 15 cents from the 2017 average. Prices increased gradually through much of the year, with significant price increases during October and November, before declining at the end of December. Growing U.S. production and low temperatures during the winter months supported increased natural gas consumption through 2018. In addition, continued increases of U.S. natural gas exports by pipeline to Mexico and additional liquefied natural gas (LNG) export capacity that came online during the year resulted in the United States exporting more natural gas than it imported for the second year in a row.
During January 2018, natural gas spot prices spiked in the Northeast as a period of prolonged cold weather affected much of the eastern United States. Spot prices at the Algonquin Citygate, which serves Boston-area consumers, and the Transco Zone 6 NY hub, which serves New York City, averaged $15.52/MMBtu and $17.67/MMBtu, respectively, in January. Daily prices reached as high as $125/MMBtu at Algonquin Citygate and $175/MMBtu at Transco Zone 6 NY on January 5. High demand for natural gas to provide space heating contributed to a record-high weekly withdrawal from U.S. storage, totaling 359 billion cubic feet (Bcf) for the week ending January 5.
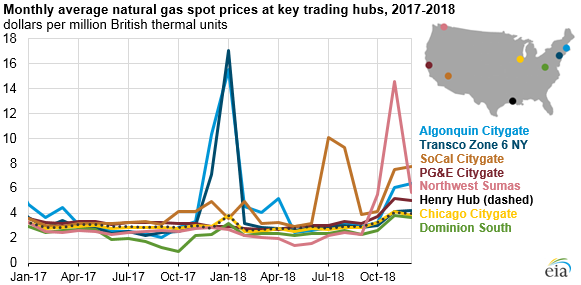
Since 2014, natural gas spot prices in Appalachia have traded at a discount to Henry Hub because pipeline capacity to flow natural gas to other regions has been limited. The spread in natural gas spot prices between the Henry Hub in Louisiana and the Appalachian region continued to narrow in 2018. Pipeline capacity buildout in the Appalachian region continued during 2018 to bring natural gas to demand centers outside the region, decreasing the price difference between the two regions.
When final data become available in the coming months, EIA expects that U.S. natural gas production will have reached record levels in 2018. Through the first ten months of 2018, dry natural gas production in the United States was 11% higher in 2018 compared with the same period in 2017. Growth has been driven by production increases in the Appalachian Basin in the Northeast, the Permian Basin in western Texas and New Mexico, and the Haynesville Shale in Texas and Louisiana.
Domestic consumption of natural gas also increased in 2018. This rise is largely driven by natural gas-fired plants replacing coal-fired plants in the electricity fuel mix, with consumption 17% higher than 2017 levels through the first ten months of the year. Increased industrial sector investment and the need for space heating and air conditioning contributed to annual growth in natural gas consumption across the industrial (5%), commercial (12%), and residential (16%) sectors during the same period.
Principal contributor: Steve Hanson


