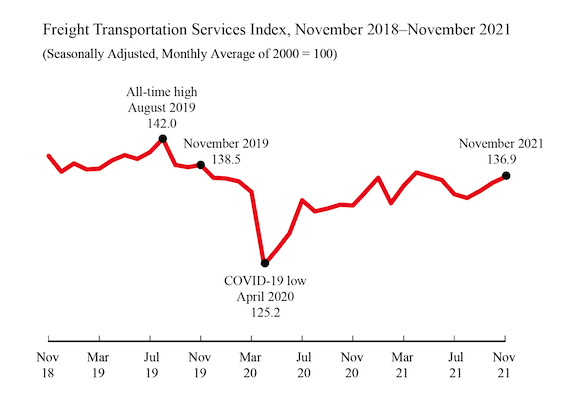
The Freight Transportation Services Index (TSI), which is based on the amount of freight carried by the for-hire transportation industry, rose 0.6% to 136.9 in November 2021 from October, the third consecutive month of increase, according to the U.S. Department of Transportation’s Bureau of Transportation Statistics’ (BTS). For-hire freight does not include the operations of fleets owned by retailers or other non-transportation companies referred to as private fleets.
From November 2020 to November 2021, the index rose 3.0% compared to a decline of 3.9% from November 2019 to November 2020 (Tables 1, 2, and 2A). It remains down 1.0% from pre-pandemic November 2019’s 138.3. The level of for-hire freight shipments in November measured by the Freight TSI was also 3.6% below the all-time high level of 142.0 in August 2019 (Table 2A). BTS’ TSI records begin in 2000.
The October index was revised to 136.1 from 135.7 in last month’s release. Monthly numbers for January and August were revised up slightly. February and July were revised down slightly.
BTS is withholding the scheduled release of the passenger and combined indexes for November. The passenger index for November is a statistical estimate of airline passenger travel and other components based on historical trends up to October 2021. The statistical estimate does not fully account for the rapidly changing impacts of the coronavirus on the historical trend. Air freight for October and November are also statistical estimates. Since air freight makes up a smaller part of the freight index, the freight TSI is being released as scheduled with the air freight estimate included. The October passenger and combined indexes are available on the BTS website.
The Freight TSI measures the month-to-month changes in for-hire freight shipments by mode of transportation in tons and ton-miles, which are combined into one index. The index measures the output of the for-hire freight transportation industry and consists of data from for-hire trucking, rail, inland waterways, pipelines and air freight. The TSI is seasonally adjusted to remove regular seasonal movement, which enables month-to-month comparisons.
Analysis: The Freight TSI increased 0.6% in November from October due to seasonally-adjusted increases in trucking, air freight, and water and decreases in pipeline, rail carloads, and rail intermodal.
The November increase came in the context of growth for other indicators. The Federal Reserve Board Industrial Production (IP) Index grew 0.5% in October, reflecting increases of 0.7% in manufacturing and 0.7% in mining, while utilities declined by 0.8%. Housing starts were up 11.8%. Personal income increased by 0.4%.
The Institute for Supply Management Manufacturing (ISM) index was up 0.3 points to 61.1, indicating continued growth in manufacturing.
Although the November Passenger TSI is being withheld because of the previously cited difficulty of estimating airline passenger travel and other components, the October index is now being released. The index increased 2.8% from September to October following an increase of 3.3% in September. Seasonally adjusted, transit, air passenger and rail passenger all grew.
The Passenger TSI has now exceeded its level in March 2020 —the first month of the pandemic— for five months in a row but remains below its pre-pandemic level (February 2020) for the 20th consecutive month.
Trend: The November freight index increase was the third increase following four consecutive months of decline. This was the fifth increase in nine months for a net increase of 2.7% over the nine months since February 2021. The November Freight TSI is 9.3% above the pandemic low in April 2020. The index is 3.6% below its record level of 142.0 in August 2019 and has increased in 13 of the 27 months since that peak.