This year marks the beginning of a recovery after a disappointing 2020, when the Covid-19 pandemic caused sanctioning of offshore projects to dip to $44 billion from $99 billion the year before. Rystad Energy projects offshore sanctioning to rebound to at least $56 billion in 2021 and keep rising to as high as $131 billion in 2023.
Operators are now even more focused on costs and profit margins, and majors are expected to concentrate their individual activity to fewer countries than before. This means the world’s resource-rich countries will have to compete more than ever to attract investments.
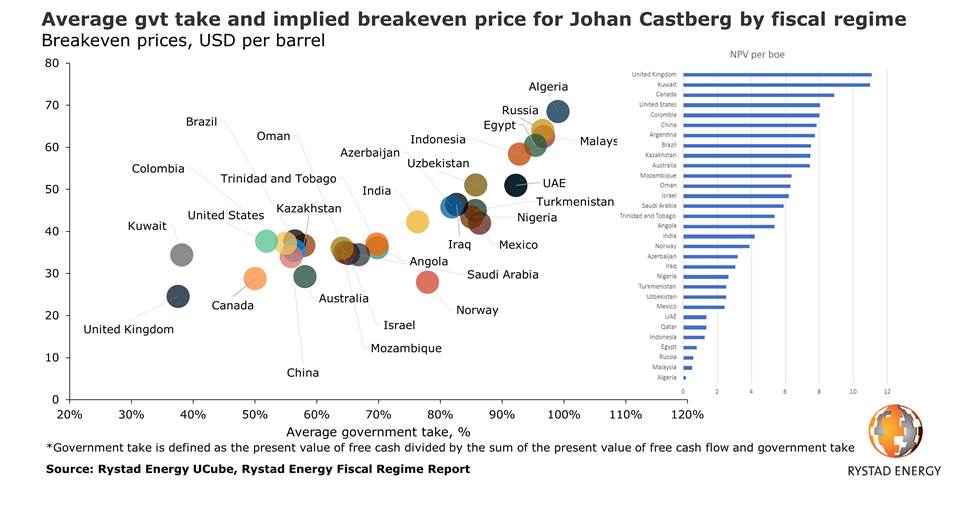
For the purpose of modelling each country’s score we have used a sample project with the characteristics of Norway’s Johan Castberg field, a single-phase project with plenty of available data that makes it an ideal candidate for benchmarking. To get a fair comparison the analysis does not take into account the activity of national oil companies (NOCs) in their home countries.
In Rystad Energy’s analysis, the United Kingdom scored the highest post-tax valuation and offers the best profitability conditions for operators, with a net present value (NPV) of $11.1 per barrel of oil equivalent (boe) in the country at a flat oil price of $70 per barrel. The next in line are Kuwait ($11 per boe), Canada ($8.9 per boe), the US ($8 per boe) and Colombia ($8 per boe).
In Norway itself, a non-NOC company would only enjoy an NPV of $3.9 per boe from the Johan Castberg project. That said, other parameters factor in for operators, as Norway is a country where the risk of exploration is lower as the country shoulders some of the cost for unsuccessful wells.

“The world’s average government take has declined in recent years and we expect that it will further drop going forward as oil and gas producing countries strive to attract foreign investors in a very competitive environment. Fiscal regimes that have higher government take will struggle to compete,“ says Espen Erlingsen, Head of Upstream Research at Rystad Energy.
For each of our analysis’ simulations, gross resources, production, prices, investments and operational costs were kept constant. The differences were in the fiscal parameters of the different fiscal regimes. The calculation of the key metrics was carried out from the approval year, which is 2018. Since there are varied fiscal regimes within the countries in the benchmarking exercise, we have selected the fiscal regime that we think best represents the country.
For Johan Castberg, the breakeven price ranges from around $25 per barrel (bbl) to around $65 per bbl under the different regimes. Some of the key mechanisms that drive up breakeven prices are high gross taxes (like royalty or export tax) or tough cost recovery methods (such as cost ceilings and deprecation spread over many years).
When it comes to breakeven prices of the project, the lowest ones are in the United Kingdom and Norway. Both countries benefit from only having net taxes (tax on profit) and an easy cost recovery system. Countries such as Indonesia, Malaysia, Egypt, Russia and Algeria are all countries with a high gross tax or tough cost recovery methods.
The complete detailed report offers further insight into profitability based on different oil price scenarios, our exact forecasts for the world’s future average government take and calculations of what governments with different fiscal regimes can expect to earn from developing what we estimate as their remaining recoverable resources.


