The 2020 U.S. Importer chart provides a detailed look at a chaotic year in international trade – a year marked by the COVID-19 crisis and political and economic upheaval.
It might be said that the 2020 U.S. Top 100 Importers chart is a reflection of U.S. trade (see page 12). Contained within the individual numbers is a year like no other – COVID-19, BREXIT and a dramatic shift in US administrations weaved into the fabric of a chaotic year in trade.
No doubt, COVID-19 was the dominant factor. More than any economic depression, the COVID pandemic influenced how things got done and the pattern of day-to-day life. And for U.S. trade, particularly on the import side, the changes were readily apparent. Home deliveries became the norm – it seemed Amazon delivery trucks were now stopping in every nook and cranny in the country, dropping off packages on backroads, country lanes and downtown Manhattan.
As countries like China and others in Southeast Asia recovered, exports to the U.S. began to soar – particularly in the fourth quarter, as reflected in the jump in GDP.
Trade Gap
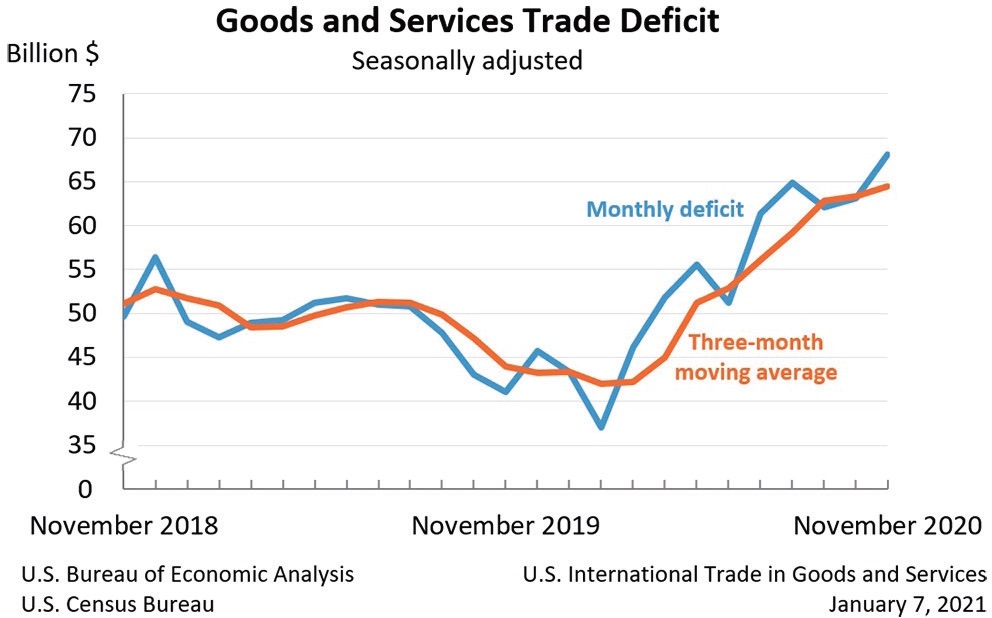
The trade deficit – the difference between exports and imports – has continued to rise, although the gap in goods narrowed to $82.5 billion in December 2020 from $85.5 billion in November. Nonetheless, under the Trump Administration’s tariff wars – designed in large part to reduce the U.S. trade deficit – the country posted three of the largest trade deficit years in the nation’s history. For 2020, the final trade deficit numbers are expected to be around $900 billion, eclipsing $878.68 billion posted in 2018. Total trade is expected to be just under $4 trillion for the year– well below the tally in 2018.
There are a number of interrelated reasons for the gap such as a strengthening dollar, which effectively makes imports cheaper and exports more expensive, which was also exacerbated by countervailing tariffs placed on U.S. exports. In terms of the US economy, the service industry – hotels, restaurants, travel and brick-and-mortar retailers, large and small, have been decimated by COVID-19 related health restrictions (see Peter Buxbaum's Retail 2021: It’s all about distribution article).
How much impact the trade deficit actually has on the economy is subject to debate. For example, to manufacture a smart phone or an automobile requires imported parts from a number of countries to assemble the finished product for export. Thus dividing up the “benefits” to each party in the economic chain is not always clear cut. This is particularly true with multinationals who operate in multiple economic regimes with shareholders and employees spread across the globe. It comes down to how much is an imported $2000 smart phone really worth? Probably just a fraction of the Custom declaration.
On the other hand, the exports of basic commodities like soybeans or coal are economically straight forward transactions. And the U.S. exports are largely lower value commodity derived while on the import side higher value consumer goods are the mainstay.
Observations on AJOT’s Top 100 Importers
As in past years, the information in the Select Importers chart was derived from Descartes Datamyne’s excellent system. The data was assembled with care, but as a caveat all information is wrought with so many variables that the final result should be viewed with prudence.
It also is worth keeping in mind that U.S. importers frequently use third parties for the entry of goods thus the numbers in the charts are largely those which appear under the importer’s own name or sourcing company.
Since many of the big retailers remain anonymous, the numbers favor those who report under their own company brand names. For example, Walmart imports well over a million TEUs per year but rarely shows over 100,000 TEUs (just over 80,000 TEUs in 2020). Home Depot and Lowes also would normally be on the list but showed few import containers under their own brand.
It is also worth noting that the TEUs themselves are often the function of adding a number of shipments together rather than an actual box. In a sense an average rather than a specific box.
In 2020, Amazon notched the top spot with just under 300,000 TEUs. The e-commerce giant probably did more than twice that figure but as they are a third party themselves the numbers are somewhat skewered downward. Target ranked #5 in the charts at nearly 134,000 TEUs and has been successful in both moving more goods through e-commerce as well as maintaining a strong brick-and-mortar business during the pandemic.
Fresh foods were also a sector that did well during the pandemic’s lockdown. Not surprisingly, both Dole at #2 (it was also #2 in 2019 survey) with over 235,000 TEUs and Chiquita at #4 with over 159,000 TEUs were in the top five in the 2020 report. While Dole and Chiquita took the top spots, Del Monte, at #12 (47,000 TEUs), Sol Group, at #17(over 35,000 TEUs), Fyffe at #18 (over 35,000) also ranked high in 2020.
Home furnishings are always a strong import sector, and with the pandemic, there has been an increase in buying activity for furniture. Ikea has been the largest furniture importer on the AJOT’s lists for a number of years and in 2020 topped the sector with over 111,000 TEUs (ranked #6 overall) although the furniture retailer was down from 128,713 TEUs posted in 2019. There were a number of others with Rooms-To-Go #11 (47,679 TEUs), Arauco Wood Products #13 (nearly 43,000 TEUs), At Home Stores # 25 (over 31,000 TEUs) and Crate and Barrel # 31 (over 25,000 TEUs) being notable.
Autos are nearly always a large sector but in early 2020 with the lockdowns, manufacturing was severely curtailed. But the first signs of rebound began in July and by the end of the year, a recovery was underway, perhaps earlier than pundits had predicted. The import numbers for tires reflected this roller coaster year. In 2020, Hankook Tire # 19 imported 34,642 TEUs compared to over 43,000 the previous year. Bridgestone #36 handled 24,141 TEUs in 2020 compared to 34,522 TEUs the year before while Michelin Tire #46 was also down 20,281 TEUs to 22,275 TEUs.
On the other hand, Continental Tire #22 was nearly flat at 32,943 TEUs compared to 32,483 TEUs in 2019 while Sumitomo Rubber #29 was slightly up 27,678 TEUs compared to 25,177 TEUs the previous year. They weren’t alone as Toyo Tire, Hercules Tire, Giti Tire and Sentury Tire were all down compared to last year.
Recovery and When?
The fourth quarter of 2020 showed a flicker of recovery with 4% growth but the recovery could easily be snuffed out should the Biden Administration struggle getting the COVID-19 pandemic under control with disruptions to vaccine distribution and failure to reboot the economy.
The Congressional Budget Office (CBO), a nonpartisan arm of the legislature, recently released a report entitled “An Overview of the Economic Outlook 2021 to 2031” in which they forecast the GDP increasing at an annualized growth rate of 1.7% between 2021-2024. This new forecast is 0.7 percent higher than the last estimate in July – prior to the vaccine rollout.
The relative optimism is based on a number of factors including the impacts of legislation (“and that no significant additional emergency funding or aid is provided [and] the economy continues to strengthen…”).
Undoubtedly, a more nuanced multinational approach to trade is a key factor for post pandemic economic growth but some trends - like the rise of e-commerce and environmentally friendly products - are well underway and the next list might be a stronger reflection of these trends.


