With dramatic volume increases, future infrastructure expenditures will need to be accelerated.
In mid-October, the Port Authority of New York and New Jersey (PANYNJ) reported there were three ships at anchor waiting for a terminal berth and that the average wait time for vessels to get into the harbor was just under a day and a half. That’s a stark contrast to the situation prevailing at some other locations, such as Southern California and Savannah, where dozens of ships wait to dock for days on end.
“Capacity is not unlimited, but we have been able to flex terminal yard and gate capacity more effectively than some other ports,” said Sam Ruda, the port director, in an exclusive interview with the AJOT. “The terminals experienced five to six years of cargo growth compressed into an 18-month period. On a percentage basis, the Staten Island terminals are experiencing the fastest growth in the port.”

Completed Infrastructure Projects Key Capacity
The availability of excess terminal capacity is not the only reason the port has been able to cope better than some others with the spike in cargo volumes, which is ahead, in terms of TEUS, by 18.8%, as of the end of August, over the pre-pandemic year of 2019. “We came into the COVID period with some major infrastructure projects in our rear view mirror,” said Ruda, pointing to the 50-foot channel improvement project and the raising of the Bayonne Bridge as among the most important.
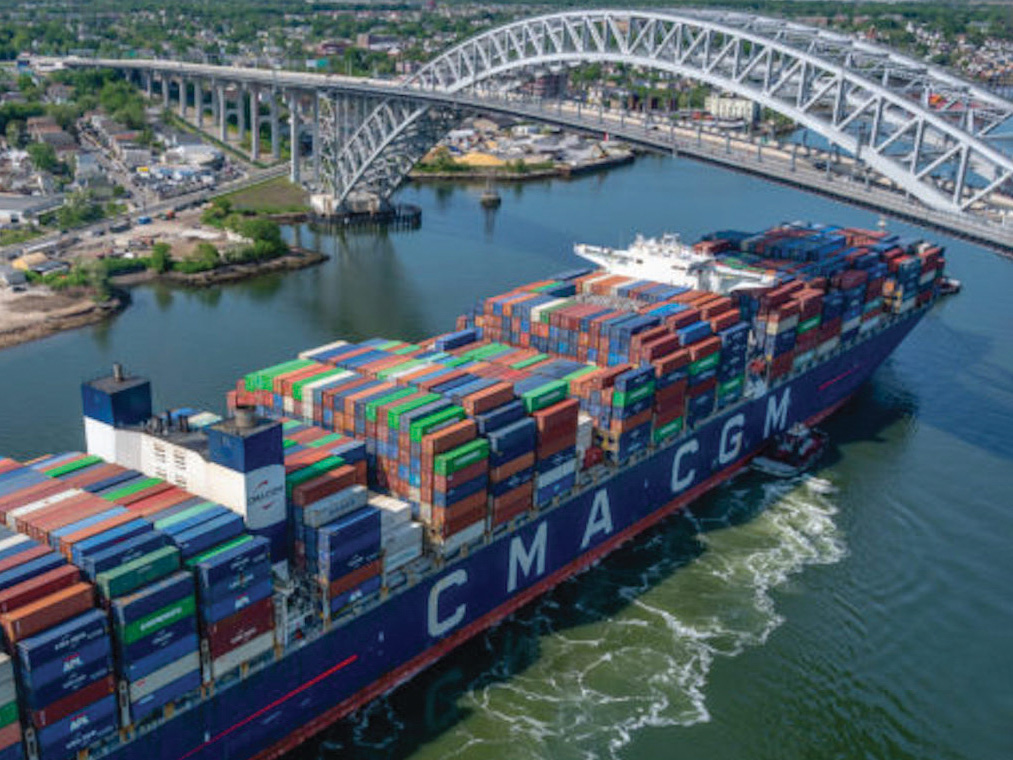
Those improvements, in particular, have allowed the port’s terminals to handle larger ships, an important factor in its ability to process higher cargo volumes. Total container vessel calls through the end of August were actually down a fraction of a percent compared to 2019, but calls by vessels over 9,000 TEU were up by over 40%. In May, the 16,000-TEU CMA CGM Marco Polo, the largest ever to call at the port, docked at Elizabeth, and unloaded 5,000 TEUs of clothing, pharmaceuticals, furniture, appliances, holiday decorations, building materials, home fixtures, and food. The Marco Polo’s capacity is over one and a half times the maximum capacity of 9,800 TEUs allowed before the 2017 raising of the Bayonne Bridge increased clearance from 151 feet to 215 feet.
“If the bridge hadn’t been raised, it would have been a major constraint and would have required considering the tides to clear the bridge,” said Ruda. “That would have magnified the problems we faced during COVID.”
Local work rules, which allow port labor to load and unload vessels 24/7, also contributed to NYNJ’s success during COVID, according to Ruda, as have expanded terminal gate hours, including Saturday operations. The International Longshoremen’s Association also helped, he said, by promoting COVID protocols that emphasized worker safety. The trucking industry, despite the endemic driver shortage, has also stepped by to move cargo into and out of the port.

Supply Chain Stressed
This is not to say that all is rosy with regional supply chains. “There are stresses in terms of trucking, warehousing, fulfillment center, and rail yard labor,” said Ruda. According to figures from the New Jersey Department of Labor, the New York City/Northern New Jersey region lost over 350,000 trade and transportation jobs between February and May of 2020, but fewer than 250,000 of those have since been filled.
“Chassis availability is also very tight,” Ruda added, “and a lot of containers moving off the port are staying out longer with importers.” The port could experience issues if importers are slow to pick up their cargo. “If yards are filled there will be nowhere to put containers,” said Ruda, alluding to problems being experienced at other ports.
The stress being put on terminal capacity is influencing the Port Authority’s approach toward future port expansion. “The planning efforts for future rounds of capital investments are going on right now,” said Ruda. “We need to keep capacity ahead of demand.”
Port Authority projections show the port will handle a record 8.9 million TEUs this year, after which volumes will decrease to 8.4 million TEUs in 2022 and 8.2 million in 2023, before proceeding on a more normalized growth pattern. Volumes are projected to grow by 5.8% between 2023 and 2025, to 8.7 million TEUs.
| Year-to-Date Container Totals | ||||||||
| YTD | Import TEUs | Export TEUs | Total TEUs | Total Rail Lifts | ||||
| Loads | Empties | Loads | Empties | Loads | Empties | Total | ||
| YTD August ‘21 | 3,034,841 | 17,290 | 914,296 | 1,968,237 | 3,949,137 | 1,985,527 | 5,934,664 | 482,642 |
| YTD August ‘20 | 2,401,697 | 14,993 | 865,419 | 1,379,344 | 3,267,116 | 1,394,337 | 4,661,453 | 451,782 |
| % Change | 26.40% | 15.30% | 5.60% | 42.70% | 20.90% | 42.40% | 27.30% | 6.80% |
| Monthly Container Totals for Port of NY/NJ | ||||||||
| August | Import TEUs | Export TEUs | Total TEUs | Total Rail Lifts | ||||
| Loads | Empties | Loads | Empties | Loads | Empties | Total | ||
| 2021 | 399,716 | 1,688 | 103,886 | 275,492 | 503,602 | 277,180 | 780,782 | 58,931 |
| 2020 | 366,887 | 1,981 | 103,067 | 216,430 | 469,954 | 218,411 | 688,365 | 64,892 |
| % Change | 8.90% | -14.80% | 0.80% | 27.30% | 7.20% | 26.90% | 13.40% | -9.20% |
Master Plan Adjustments
The Port Authority has been working off a 30-year master plan, published in 2019. But recent developments “has changed the planning horizon,” said Ruda, “so we’ll need terminal operators to accelerate the next tranche of capacity growth,” to include investing in new equipment and implementing higher levels of terminal densification. “We don’t have the luxury of time given the growth we’ve seen,” he said.
As the port landlord, the Port Authority’s responsibilities include projecting trends, planning accordingly, and sharing its conclusions with terminal operators. They, in turn, may have some requests of the Port Authority, such as preemptively lengthening the terms of their leases so that they can amortize new capital commitments over a longer period.
Perhaps the only certainty facing the port at this point is uncertainty. The COVID-19 pandemic is still far from over, and, even if some progress has been seen at home, the same is not reflected in some other regions of the globe. With the virus raging in Southeast Asia, 80% of production facilities in Vietnam are currently locked down and are not expected to come back online until mid-January. As importers fear further waves of production shutdowns, they will continue to accumulate inventory, exacerbating the situation at U.S. ports and worsening supply-chain headaches.
Besides all that, weather-related disruptions and spikes in labor and energy costs will also provide their share of “bumps along the road,” said Ruda. “Given the quantity of volumes in the supply chain right now, small events will have big impacts,” he added.”


