The top containership carriers are bigger and more efficient but service disruptions show weaknesses in the industry.
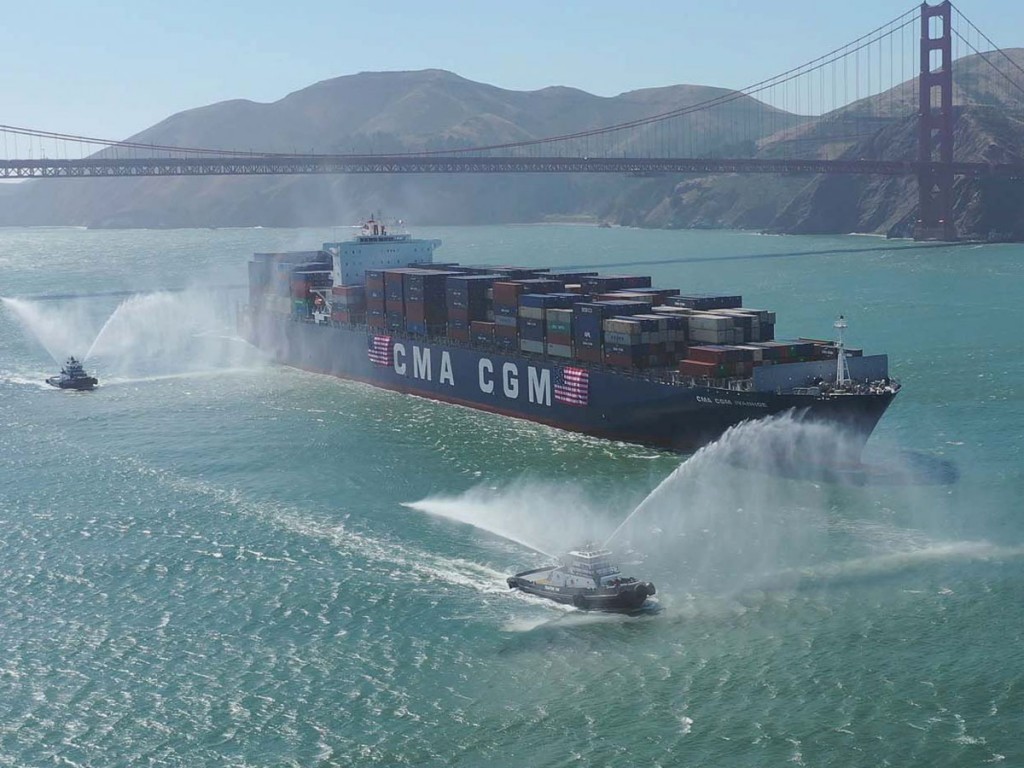
Ocean carriers rarely make front page news, but in recent weeks the container business has made the news for reasons the industry would rather have avoided. There have been ongoing problems of congestion primarily at West Coast ports and the inability to expediently reposition equipment back to Asia for refilling. The lack of equipment for U.S. exports has led to complaints from American shippers to Washington that the carriers aren’t responsive to their needs. Freight rates have soared and this too has raised the ire of U.S. importers and exporters alike who are trying to dig themselves out from pandemic economics. And finally, the 20,000 TEU Ever Given made headlines worldwide by getting stuck in the Suez Canal. The ensuing backup of containerships spread through the global supply chain choking an already stressed supply chain and added to the ire of an already irritated shipping public. As if this wasn’t enough, hacks and other IT calamities have dogged carriers in ways once unimaginable and now becoming part of shipping life, like identity fraud is for shoppers. Still, through all the turmoil, the ocean carriers are making an almost unparalleled financial rebound – being dubbed the “disruption upside” – which again is a touchy issue among shippers and consumers that have endured lockdowns and layoffs for over a year and a half and haven’t shared in the carriers’ good fortune.
At the Propellor Club of Northern California (PCNC) February 23rd Zoom meeting, Lars Jensen, CEO of Copenhagen-based SeaIntelligence Consulting gave a presentation of the state of container shipping and in particular the congestion facing the California ports of Los Angeles and Long Beach. Jensen’s presentation was a masterclass in shipping economics and on the critical question of what could be done to relieve congestion, he advised “patience” explaining only a lowering in demand would over time untangle the supply chain.
With approximately one percent of the world’s boxes sitting at anchor in San Pedro Bay, speeding up discharge at the expense of loading wouldn’t solve the problem. Nor would adding ships and more containers, which would only exacerbate the traffic jam in San Pedro Bay.
In a sense, the ocean carriers had to choose their poison – reposition the empties back to Asia as soon as possible to reload them with high value, light, consumer goods – or try to load them in the U.S. market with low value, heavy exports such as agricultural items – and lose time and potentially money in the process.
As Jensen explained, the whole mess began with the pandemic in 2020 and this is where “globalization shows its ugly side and when you have a global problem it effects every trade lane.” The pandemic caused a “massive drop in April and May [2020]…followed by an astonishing comeback.” And the comeback directly led to equipment shortages and congestion issues on the U.S. West Coast.
As the supply chain problems deepened, the ocean carriers largely opted for plan A, much to the chagrin of agricultural shippers needing boxes and complaints to Congressional leaders ensued. On March 9th, a group of Democratic and Republican Congressional representatives led by John Garamendi (D-CA) and Jim Costa (R-CA) presented a bipartisan letter to Michael A. Khouri, chair of the Federal Maritime Commission (FMC), voicing concern over reports that certain vessel-operating common carriers (VOCCs) are declining to ship U.S. agricultural commodity exports from U.S. ports. Costa said, “It is critical that we resolve supply chain issues so our producers can quickly ship healthy, nutritious food around the world. Food is a national security issue and we cannot allow for disruptions to this system.”
Of course, this all was happening before the Evergreen’s Ever Given wedged itself across the Suez Canal on March 23rd, thoroughly gumming up the already sticky issues within the supply chain.
Quite beyond the actual blockage, the incident was a capacity sucking event – beginning with rerouting of vessels over longer trade lanes such as the Cape of Good Hope. The problem is that a leaner more efficient industry doesn’t have much surplus capacity built into it – especially in the VLCS (Very Large Containership ) and ULCS (Ultra Large Containership) linehaul classes. As a result, ocean carrier schedules are still being disrupted. For example, project 44, a visibility platform for shippers and logistics providers, estimates that 1.9 million TEUs of capacity was involved in the Ever Given event and “cumulative delays for cargo ships are at 1,017 days.” The company adds that a tsunami of boxes is hitting ports, citing “Singapore, more than 370,000 TEU of capacity are en-route to the port, where 83 vessels representing 299,310 TEU were already at the port or anchored and waiting to unload as of April 12.”
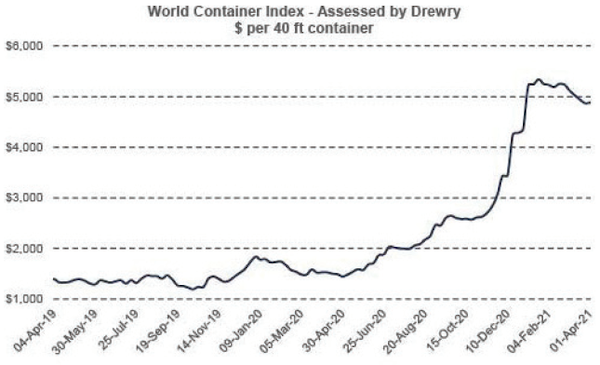
Even with – or because – of these supply chain issues; freight rates have continued to remain high. FBX on April 7th reported “Asia-US West Coast prices” had increased 4% to $5,375/FEU (Forty Foot Equivalent Unit). This rate is 251% higher than the same time last year. And it was much different on the Asia-US East Coast prices which climbed 2% to $5,868/FEU, and are 108% higher than rates for this week last year. Drewry’s composite World Container Index for April 1st reflected the same phenomenon as it was up 0.2% to $4,883.43 per FEU. (see WCI graph below)
Diving Into The Numbers
Somewhat lost in all the turmoil was how much ships and shipping has changed in a relatively abbreviated timeframe – and how these changes have contributed to the vulnerabilities of the supply chain.
It takes only a cursory glance at the Top 50 ocean container carriers, to see it is heavy at the top [see Top 50 Ocean Container Carriers chart]. Since the mid-2000s consolidation has concentrated a preponderance of container slots into the hands of roughly ten ocean carriers. The disparity between the Top 10 and the rest is clear in comparing the fleet composition data. For example, the Top 10 carriers together deploy 3,296 vessels amounting to 20,577,630 TEUs (extrapolated from Singapore-based Alphaliner data). While the remaining 90 container ship operators comprising the rest of the Top 100 container lines, are composed of 2,069 vessels of 3,359,658 TEUs – or put another way, 1,227 less ships and a mind boggling 17,217,972 less TEU capacity than the Top Ten.
The difference between the Top 10 carriers and the rest is also expressed in vessel size. The average size based on TEUs for the Top 10 carrier is 6,243 TEUs while for the next 40 carriers (AJOT’s Top 50) 1,809 TEUs. And for the group of carriers 40-100 the size slips to 1,624 TEUs. The gap in size and slots is also projected to widen based on ships-on-order. The current orderbook for the Top 10 carriers is 1,297 vessels of 2,608,587 slots for an average size of 13,242 TEUs. Conversely, the next 90 carriers have combined orderbook of 126 ships of 344,580 TEUs or an average size of 2,735 TEUs.
What stands out is the jump in the average size for the next wave of ship orders. The average size of 13,242 TEU for new ships entering the containership fleet is over twice the size of the current average for the Top 10 carriers. This jump in size is less about a change in ordering philosophy – going big is a mantra in shipping – and more about the statistical impact of industry consolidation, a period during which top tier ocean carriers absorbed into their fleets smaller size vessels from their acquisitions (see below) and a slow-down in ordering following the implementation of IMO 2020 limiting the sulphur content of marine fuels.
Dizzying Speed of Consolidation
What is remarkable is the dizzying speed in which the industry’s top-tier built an overwhelming superiority in ships and TEU capacity compared to the rest.
Seven years ago, in the AJOT’s “2014 Ocean Carrier Review,” the Top 10 containership carriers’ fleet totaled 2,455 ships with a capacity of 11,388,999 TEUs for an average size of 4,639 TEUs. The next 90 carriers had a fleet entailing 2,722 ships with a capacity of 5,128,882 TEUs. Unlike today the next 90 shipping lines on the list had a larger fleet (2,722 ships to 2,455 ships) and the difference in capacity between the Top 10 and the bottom 90 was only 6,260,117 TEUs. Even the average TEU capacity comparison was a relatively narrow 4,639 TEUs to 1,884 TEUs.
So, what happened? A quick review of the Top 20 shipping lines of 2014 illustrates the impact of consolidation. For example, #7 APL is now part of CMA-CGM, #8 Hanjin went bankrupt, #9 China Shipping is now part of COSCO, as is #13 OOCL, #11 Hamburg Sud is now part of Maersk, while #19 UASC and #20 CSAV merged into Hapag Lloyd while the Japanese carriers #10 MOL, #12 NYK and #17 K Line merged into a new containership operator ONE. In short, half of the top twenty operators were merged into the Top 10.
What drove this consolidation? The bottom line. Ocean carriers weren’t getting a sufficient ROI (Return on Investment) as there were too many ships chasing too little freight and doing so at rates too low to produce profits and sustain growth. The South Korean carrier Hanjin’s bankruptcy was simply an exclamation point and a reminder that anyone could fail if the system didn’t change.
Flipping the Script
The ocean carriers were able to flip the script quickly from the Hanjin debacle. They did so by emphasizing economies of scale as the guiding principle in dictating vessel acquisition and deployment. A tactic designed to achieve lowest costs per TEU moved. The carriers’ also embarked on re-engineering the backroom IT’s to achieve greater efficiencies while becoming a more dynamic part of the supply chain itself. From these endeavors, a very different industry emerged: A leaner, more efficient but increasingly top-heavy industry. And it is an industry that when the ocean carrier alliances – carrier networks – are taken into consideration (see Alliances on page 6) is really only a three party affair.
Given the compression can the system of container carriage be ratcheted down any tighter without something breaking?
Where does the industry go next? Still bigger ships? Or automated ships? New fuels or old fuels? Will the carriers charter in more ships and go asset-light in the future? Or will carriers expand into other transport modes like air, truck and rail? Will there be more mergers and acquisitions? Maybe new ocean carriers? Bigger carrier alliances? More IT integration with supply chain? And in keeping with supply chain integration, more service offerings outside of the traditional role of an ocean carrier?
So, many questions, so many directions.
It was a remarkable industry makeover that happened in just seven years. So, what will the industry look like in 2028?


