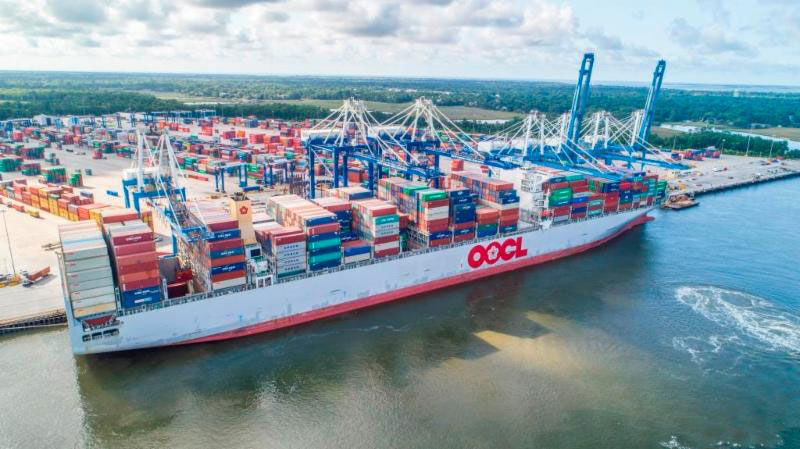
Atlantic and Gulf Coast ports are gaining ground against the Ports of Los Angeles and Long Beach as well as other US West Coast ports, according to the Pacific Merchant Shipping Association (PMSA) West Coast Trade Report.
The February 2018 noted: “There was a time when East Coast ports handled the majority of the nation’s container trade. The emergence of China as a force in global trade changed that. Now with the opening of a new set of locks at the Panama Canal coupled with a shrinking differential in transpacific container rates between the two coasts, the West Coast’s dominance is being steadily imperiled.”

To be sure, the USWC total of 54,213,303 metric tons in East Asian imports last year was more than double the 21,785,439 metric tons that arrived at USEC ports. But, as a harbinger of the future, the USEC ports’ upswing of 2,553,342 metric tons in East Asian containerized imports was ominously larger than the 1,501,688 MT increase in East Asian imports recorded by the USWC ports last year.”
Inbound loaded containers at the Ports of Los Angeles and Long Beach totaled 8,579,276 TEUs, a gain of 7.4% (+591,954 TEUs) over Calendar Year 2016 and this total also exceeded the previous combined high the two ports set in 2006, but East and Gulf Coast ports are doing better:
”Almost uniformly, East and Gulf Coast ports ran up strong rates of growth for both December and for the year. Collectively, the number of loaded inbound containers arriving at the ten East Coast ports we track were up 7.7% (+55,916 TEUs) in December and 8.2% (+715,911 TEUs) for the year… The export loaded TEU (twenty-foot unit container) side, the numbers continued to be disappointing for USWC (US West Coast) ports.“
PMSA noted the US West Coast ports’ loss of market share from East Asia:
In dollar-value terms, “USWC ports likewise saw their share of containerized imports from East Asia trade tumble to 66.9% from 70.5% in November and from 69.2% in December 2016. “
The Ports of Los Angeles and Long Beach “together held a 52.9% share of containerized imports by dollar-value, down from 56.7% a month earlier from a 54.3% share in December 2016. “
The report noted that “Economies worldwide are in an unusual period of synchronized growth. That alone should normally drive up export volumes. Add to this a dollar that has been weakening steadily all through 2017, and we should have a formula for expanded shipments to overseas markets.”
This is not manifesting itself in big gains for US West Coast ports where data for outbound loaded containers in 2017 showed “the San Pedro Bay ports recorded an unfashionably slender 0.7% (+22,400 TEUs) increase in loaded outbound boxes” and that “Remarkably, the CY2017 total (3,370,441 TEUs) fell short of the numbers the two ports exported in every year from 2010 through 2014.”
PMSA also noted that in 2017:
Oakland “fared even worse for the year, showing a 1.8% (-17,142 TEUs) drop in loaded outbound
At the NWSA (Seattle-Tacoma) ports, “export container traffic sagged by 5.8% (-56,929 TEUs) from the previous year.”
Collectively, the five major USWC container ports shipped 1.0% (-51,631 TEUs) fewer containers in 2017 than they had in 2016.
Pacific Coast ports—whether in the U.S., Canada or Mexico – “had a generally dismal experience with exports.”
This stood in contrast to the much healthier growth trends at most East and Gulf Coast ports. U.S. Commerce Department statistics showed that based on “declared value of containerized imports at U.S. mainland ports, USWC ports held a 47.9% share in December, down from 50.4% in November and from a 49.3% share in December of 2016. At the Ports of Los Angeles and Long Beach, the combined share of the value of mainland U.S. containerized imports in December was 37.2%, down from 39.8% in November and from 38.0% the previous December.”
US containerized trade with the economies of East Asia in 2017 showed that in dollar-value terms:
USWC ports “likewise saw their share of containerized imports from East Asia trade tumble to 66.9% from 70.5% in November and from 69.2% in December 2016.”
The Ports of Los Angeles and Long Beach “together held a 52.9% share of containerized imports by dollar-value, down from 56.7% a month earlier from a 54.3% share in December 2016.”
On a value basis, “the USWC share of containerized exports to East Asia in December edged down to 62.5% from 63.6% in November and from 66.7% in the last month of 2016.”
The San Pedro Bay ports also saw their share of the dollar value of containerized exports slip to 43.4% from 43.7% in November and from 47.7% in December 2016.”


